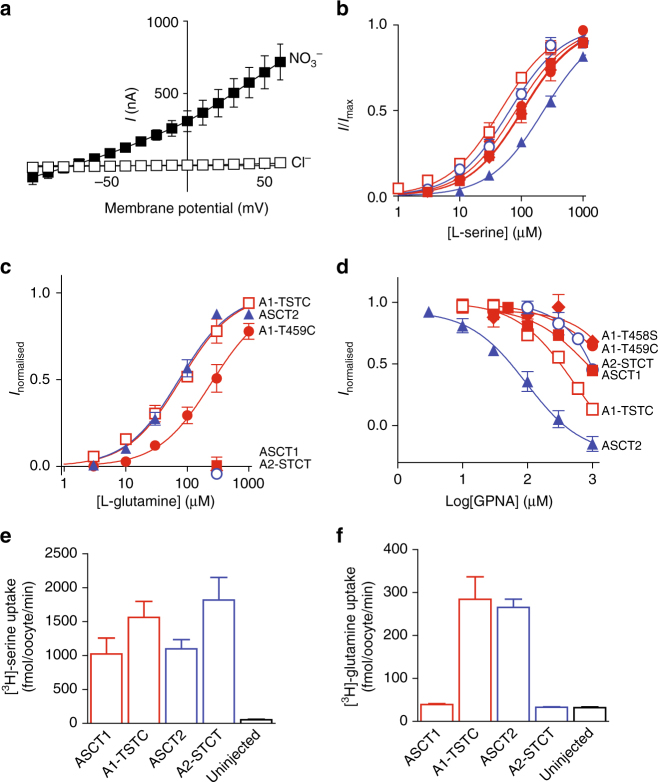
Fig. 2.
Mutations in ASCT1 and ASCT2 affect substrate and inhibitor selectivity a Current–voltage relationships elicited by 300 µM L-serine in Cl−-containing buffer (open squares) and NO3 −-containing buffer (closed squares), at pH 7.5 in wild-type ASCT1. Concentration–response curves are shown for L-serine b and L-glutamine c in ASCT1 (red, closed squares), ASCT2 (blue, closed triangles), A1-T458S (red diamonds), A1-T459C (red, closed circles), A1-T458S/T459C (red, open squares) and A2-S481T/C482T (blue, open circles) at+60 mV. As L-glutamine concentration–response curves for ASCT1, A1-T458S and A2-S481T/C482T was not determined, data were normalised to the predicted maximal current for L-serine for each transporter. d Concentration–response curves are shown for GPNA in ASCT1 (red, closed squares), ASCT2 (blue, closed triangles), A1-T459C (red, closed circles), A1-T458S (red diamonds), A1-T458S/T459C (red, open squares) and A2-S481T/C482T (blue, open circles). GPNA was co-applied with an EC50 value of L-serine for the respective transporters and normalised to the current generated by the application of L-serine alone. L-[3H]serine e and L-[3H]glutamine f uptake into oocytes expressing wild-type and mutant ASCT1 (red), ASCT2 (blue) transporters and uninjected control oocytes (black). Oocytes were incubated in Cl−-containing buffer with 10 µM L-[3H]substrate at room temperature, pH 7.5 for 10 min. Values presented are mean ± S.E.M, (n ≥ 3)

