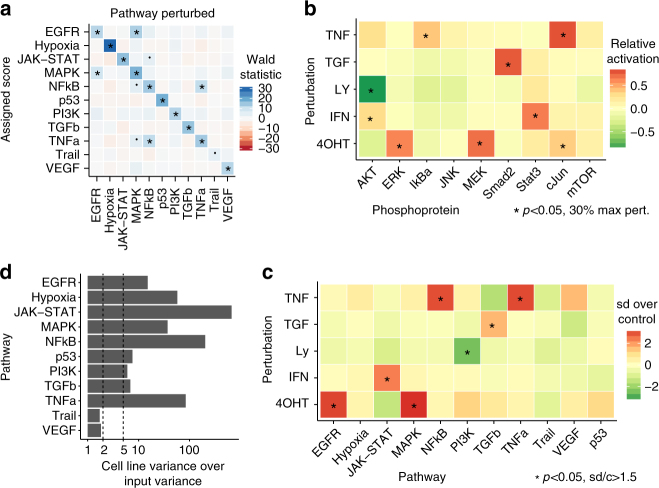
Fig. 2.
Evaluation of pathway-response signatures. a Associations for PROGENy pathway scores with experimental perturbation for experiments that the model was not built with (leave-one-out cross-validation). Each pathway is strongly associated with its own perturbation, and we observe few cases of cross-talk in agreement with biological knowledge. b Pathway perturbations in HEK293 cell line activate the corresponding signaling proteins. MEK and ERK for MAPK pathway, Stat3 for Interferon-induced JAK-STAT, AKT for PI3K, Smad2 for TGFb, and IKb for TNF-alpha-induced NFkB. As expected, all increased upon stimulation except AKT that decreased upon inhibition. Activation shown relative to maximum readout per antibody, p values reported for one-sample one-sided t test. Results are significant if p < 0.05 and perturbation is at least 30% of maximum. c PROGENy correctly infers pathway activity from gene expression in the HEK293 experiments. Associations are significant if p value of two-sample one-sided t test <0.05 and experiments are at least 1.5 standard deviations above or below the control. d Stability of basal pathway scores when bootstrapping input experiments. Bars show how much more variance in pathway scores (GDSC panel) is introduced by cell line identity over using resampled perturbation experiments in model building. Variance by cell line is over five times as high for most pathways, and roughly twice as high for Trail and VEGF

