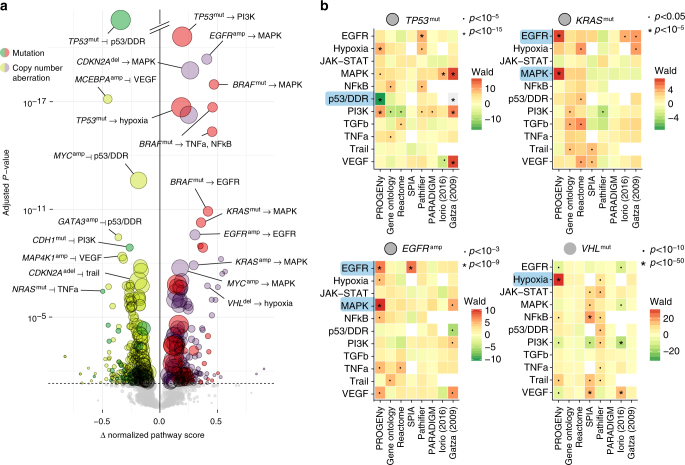
Fig. 3.
Ability of pathway methods to recover well-known mutations. a Volcano plot of pan-cancer associations between driver mutations and copy number aberrations with differences in pathway score. Pathway scores calculated from basal gene expression in the TCGA for primary tumors. Size of points corresponds to occurrence of aberration. Type of aberration is indicated by superscript “mut” if mutated and “amp”/”del” if amplified or deleted, with colors as indicated. Effect sizes on the horizontal axis larger than zero indicate pathway activation and smaller than zero indicate inferred inhibition. P values on the vertical axis FDR-adjusted with a significance threshold of 5%. Associations shown without correcting for different cancer types. Associations with a black outer ring are also significant if corrected. b Comparison of pathway scores (vertical axes) across different methods (horizontal axes) for TP53 and KRAS mutations, EGFR amplifications and VHL mutations. Wald statistic shown as shades of green for downregulated and red for upregulated pathways. P value labels shown as indicated. White squares where a pathway was not available for a method

