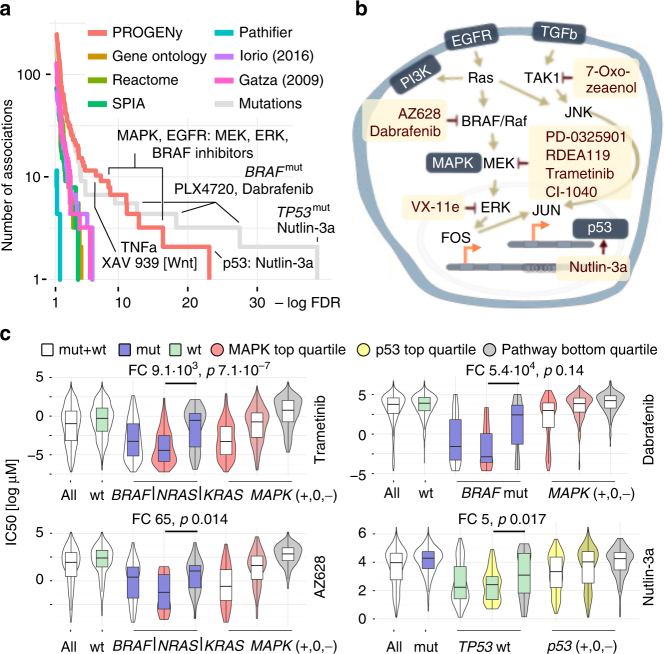
Fig. 4.
MAPK and p53 scores drive drug response across all cancer types. a Comparison of the associations obtained by different pathway methods. Number of associations on the vertical and FDR on the horizontal axis. PROGENy yield more and stronger associations than all other pathway methods. Mutation associations are only stronger for TP53/Nutlin-3a and drugs that were specifically designed to bind to a mutated protein. PARADIGM not shown because no associations <10% FDR. markers (green) and greater than zero resistance markers (red). P values FDR-corrected. b Pathway context of the strongest associations (Supplementary Fig. 10) between EGFR/MAPK pathways and their inhibitors obtained by PROGENy. c Comparison of stratification by mutations and pathway scores. MAPK pathway (BRAF, NRAS, or KRAS) mutations and Trametinib on top left panel, AZ628 bottom left, BRAF mutations and Dabrafenib top right, and p53 pathway/TP53 mutations/Nutlin-3a bottom right. For each of the four cases, the leftmost violin plot shows the distribution of IC50s across all cell lines, followed by a stratification in wild-type (green) and mutant cell lines (blue box). The three rightmost violin plots show stratification of all the cell lines by the top, the two middle, and the bottom quartile of inferred pathway score (indicated by shade of color). The two remaining violin plots in the middle show mutated (BRAF, KRAS, or NRAS; blue color) or wild-type (TP53; green color) cell lines stratified by the top- and bottom quartiles of MAPK or p53 pathways scores (Mann–Whitney U-test statistics as indicated)

