Fig. 1.
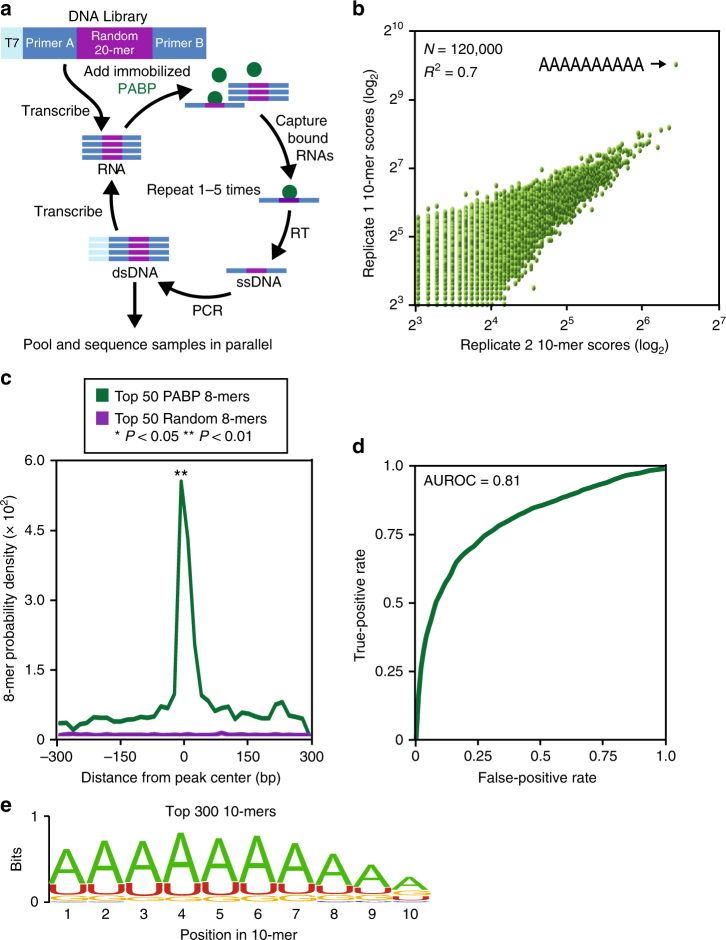
Unbiased assessment of PABP specificity and in vivo confirmation. a The SEQRS strategy begins with in vitro transcription of a DNA library containing a T7 primer (light blue), two constant regions (Primers a and b, dark blue), and a randomized 20-mer (purple). Following in vitro transcription, the library was incubated with PABP immobilized onto magnetic resin (green). RNA–protein complexes were isolated through wash steps and the bound RNAs were reverse transcribed. The T7 promoter was reattached through incorporation into a PCR primer and the process was repeated for five rounds prior to Illumina high-throughput sequencing. b Reproducibility of SEQRS. The most abundant 120,000 sequences for SEQRS replicates have a Pearson’s correlation coefficient of 0.7. The most enriched 10-mer sequence is an adenosine homopolymer and is indicated with an arrow. c Positions of the 50 most enriched 8-mer sequences from SEQRS for either PABP (green) or random sequences (purple) were calculated across known sites of PABP association outside of the Poly(A) tail in cells25. Enrichment scores were calculated based on the Mann–Whitney U test. d The area under the receiver operator curve is 0.81. e The sequence logo based on the top 300 10-mer sequences following SEQRS

