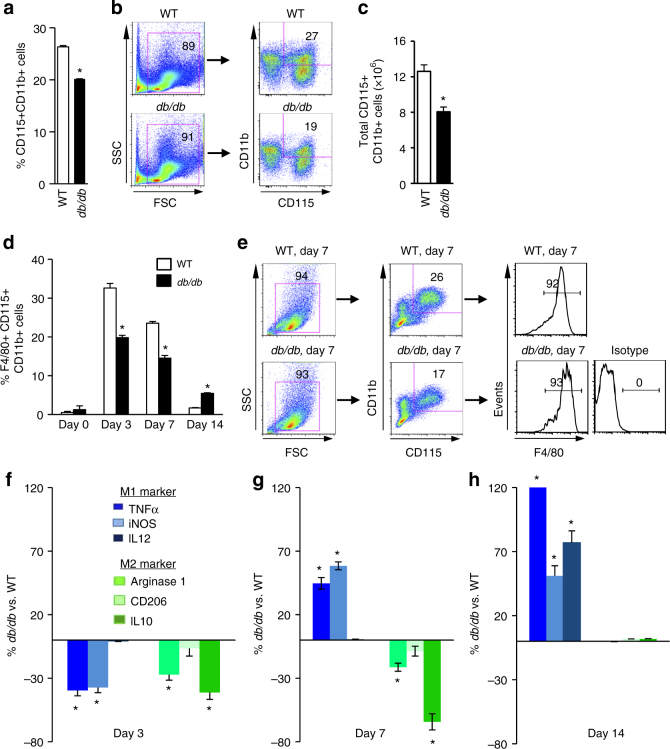
Fig. 2.
Type 2 diabetes reduces macrophage infiltration into wounds. a Quantification of monocytes concentration in bone marrow by flow cytometry (n = 6, *p < 0.05 vs. WT). b Schematic of flow cytometry gating. c Quantification of absolute number of monocytes in bone marrow (n = 6, *p < 0.05 vs. WT). d Quantification of macrophage concentration in the cutaneous wounds by flow cytometry (n = 6, *p < 0.05 vs. WT). e Schematic of flow cytometry gating. f–h Quantification of M1/M2 polarization in the cutaneous wounds by flow cytometry (n = 6, *p < 0.05 vs. WT). Results are expressed as means ± SEM. Two-tailed unpaired Student’s t test was used for a, c, d, f, g, h

