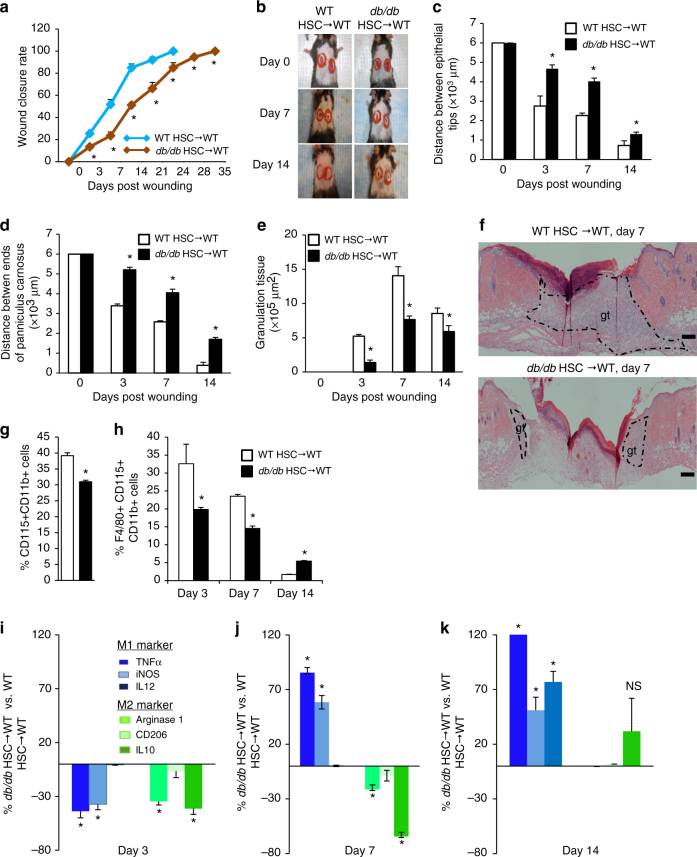
Fig. 3.
Type 2 diabetes impairs wound healing and monocytes/macrophages infiltration. a, b Wound closure rate measurement and representative images (n = 8, *p < 0.05 vs. WT HSC → WT). c–e Histological quantification of distance between epithelial tips/ends of panniculus carnosus and granulation tissue (n = 4, *p < 0.05 vs. WT HSC→WT). f Representative H&E staining wound images, magnification ×40. Scale bar, 100 μm. gt, granulation tissue. g Quantification of monocytes concentration in bone marrow by flow cytometry (n = 6, *p < 0.05 vs. WT HSC → WT). h Quantification of macrophage concentration in the cutaneous wounds by flow cytometry (n = 6, *p < 0.05 vs. WT HSC → WT). i–k Quantification of M1/M2 polarization in cutaneous wounds by flow cytometry. (n = 6, *p < 0.05 vs. WT HSC → WT). Results are expressed as means ± SEM. Two-tailed unpaired Student’s t test was used for a, c–e, g–k

