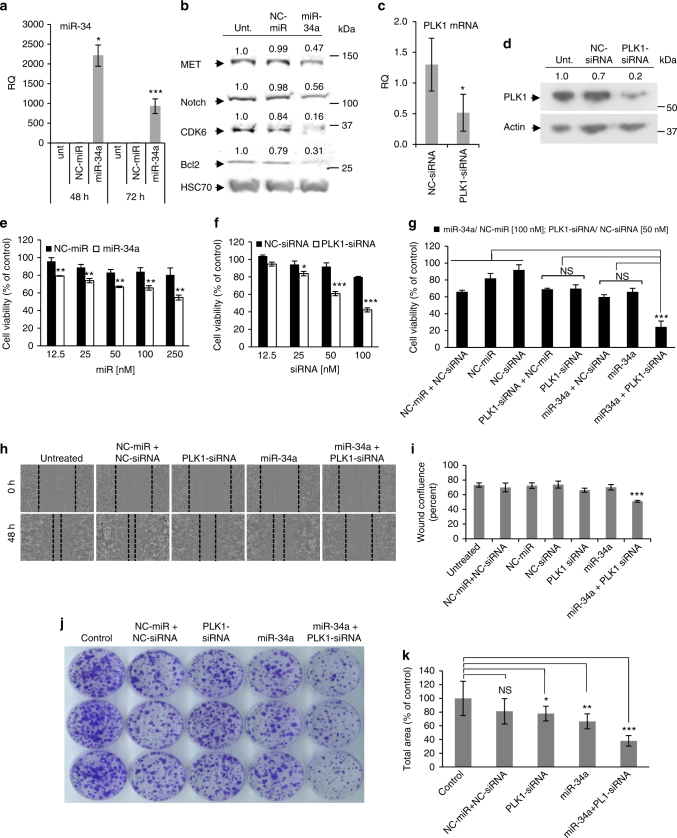
Fig. 4.
Proliferation, migration and survival inhibition of MiaPaCa2 cells following treatment with APA nanocarrier containing miRNA–siRNA combination. a miR-34a levels in MiaPaCa2 cells following treatment with APA polyplexes containing miR-34a or NC-miR, quantified relative to U6 RNA using qRT-PCR, showing in vitro delivery efficacy by APA nanocarrier. Untreated cells served as control. b miR-34a’s target genes (CDK6, MET, Notch, and Bcl2) levels 48 h following the same treatment as in a. c PLK1 mRNA levels following treatment with APA polyplexes containing PLK1-siRNA or NC-siRNA for 24 h, quantified relative to GAPDH mRNA using qRT-PCR. d PLK1 protein levels following the same treatment as in c. Densitometric analysis of western blot is presented as percentage of band intensity compared to untreated cells (unit). e–g Proliferation of MiaPaCa2 cells following treatment with APA polyplexes containing different concentrations of miR-34a or NC-miR e, PLK1-siRNA or NC-siRNA f, or miR-34a (100 nM) and PLK1-siRNA (50 nM) combination g. Statistical significance is shown for the comparison between miR-34a and NC-miR in e and between PLK1-siRNA and NC-siRNA in f (n = 3). h, i Migration of MiaPaCa2 cells 48 h following incubation with the same treatments as in g. Representative images of the cells from 0 to 48 h time points h quantified as wound confluence (percent out of initial wound at time 0) using the IncuCyte software i. (2 biological repeats were done in triplicates). j Representative images of cell survival via colony formation assay for 11 days. k Quantification of colonies from 3 biological repeats as their total area relative to untreated cells (control) using ImageJ software (experiments were done in triplicates). Data represent mean ± SD. (Student’s t-test, NS; not significant for P > 0.05, *P < 0.05, **P < 0.01, ***P < 0.001.)

