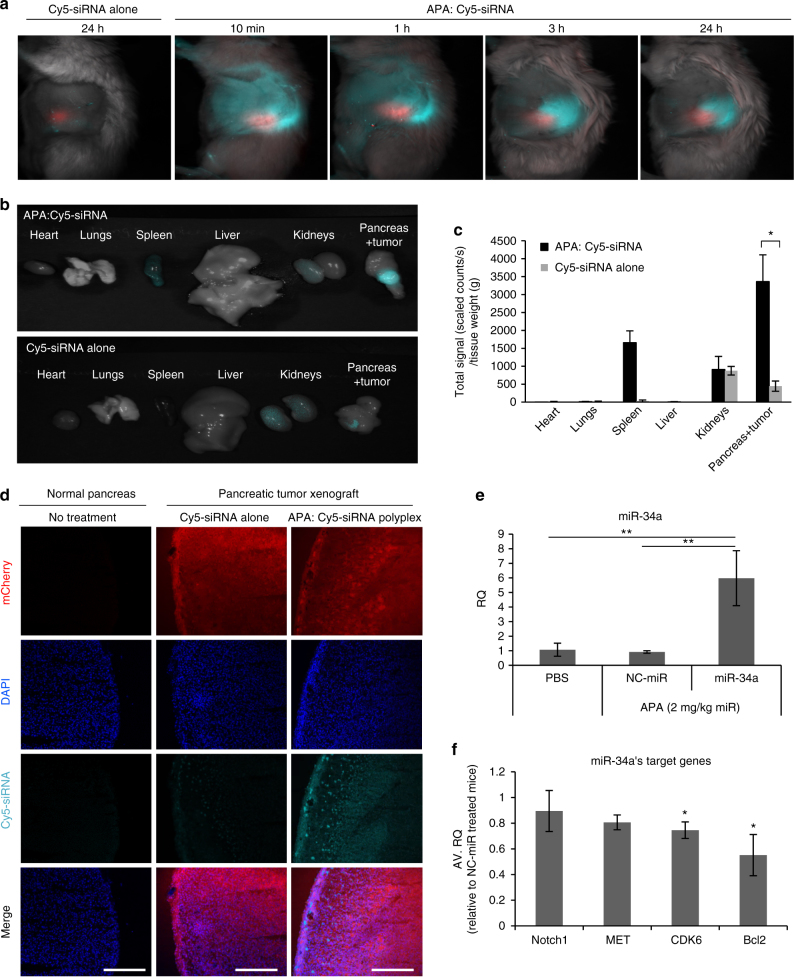
Fig. 6.
Biodistribution and accumulation of APA-miRNA–siRNA polyplexes in orthotopic pancreatic tumor-bearing mice. a APA:Cy5-labeled siRNA polyplexes or Cy5-labeled siRNA alone (0.5 mg kg−1 siRNA dose) were injected i.v. to mCherry-labeled tumor-bearing (~1000 scaled counts per second) mice. At 10 min, 1, 3, and 24 h mice were imaged by non-invasive intravital fluorescent microscopy for mCherry (red) and Cy5 (light blue) fluorescent signals. Representative images of the mice are shown (n = 3). b, c Twenty-four hours following intravenous injection of the same treatments as in a, tumor and healthy organs were resected, imaged b and quantified for their Cy5 fluorescent signal intensity c (n = 3). d Resected tumors were embedded within OCT, cut to 10 µm sections, stained with DAPI and subjected to confocal microscopy. Normal pancreas was used as control. Scale bar, 250 µm. e Relative miR-34a levels in PDAC tumors following intravenous injections (3 consecutive, once a day) of APA-miR-34a or APA-NC-miR (2 mg kg−1 miR dose) or PBS, quantified by qRT-PCR (n = 4). f miR-34a target genes level following injection of the same treatments as in e, quantified by qRT-PCR (n = 4). Data represent mean ± SEM in c and mean ± SD in e and f. (Student’s t-test, *P < 0.05, **P < 0.01)

