Fig. 1.
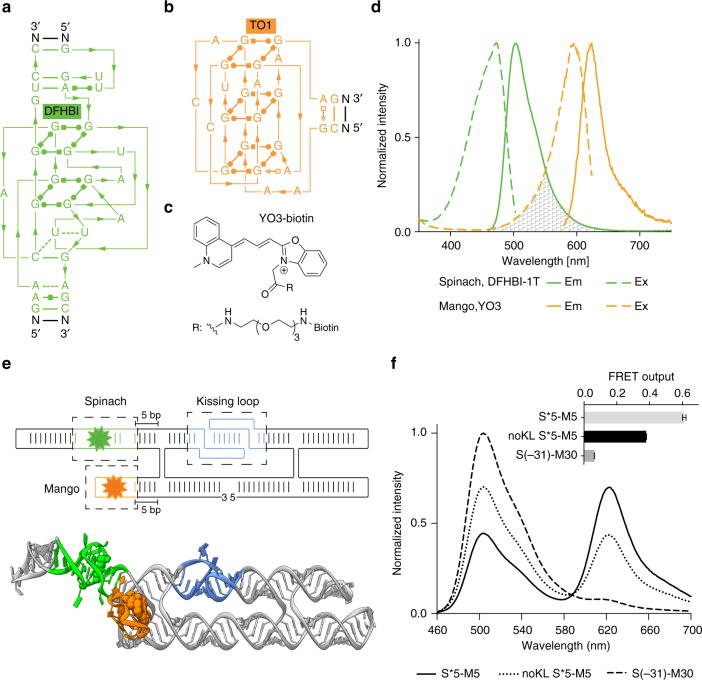
FRET between fluorescent aptamers on RNA origami scaffolds. a Structure diagram of the minimal core of the Spinach aptamer31, 32 (green). The binding site of DFHBI-1T is indicated. Lines with arrows denote chain connectivity and Leontis-Westhof symbols52 denote noncanonical base pairs. b Structure diagram of the minimal core of the Mango aptamer26 (orange). The binding site of TO1-biotin is indicated26. c Chemical structure of YO3-biotin. d Excitation and emission spectra of DFHBI-1T and YO3-biotin in the Spinach and Mango construct, respectively. Spectral overlap between the emission spectrum of DFHBI-1T and the excitation spectrum of YO3-biotin is marked in gray. e 2D diagram and 3D model of an aptamer-based FRET (apta-FRET) construct showing the kissing-loop (blue), Spinach (green), and Mango (orange). The stem length between the construct crossover and both Spinach (S) and Mango (M) is 5 bps (and is thus named “S*5-M5”, see text and Fig. 2 for further descriptions of nomenclature). The 3D model is shown in cartoon representation with fluorophores shown in space-fill representation. f Fluorescence spectra of apta-FRET constructs after excitation of DFHBI-1T. The solid line is the S*5-M5 construct, the dotted line is the S*5-M5 construct designed without a kissing-loop (KL), and the dashed line is the S(-31)-M30 construct designed to have no FRET. The inset shows calculated FRET outputs of the three constructs. Error bars indicate standard deviations calculated using triplicate measurements

