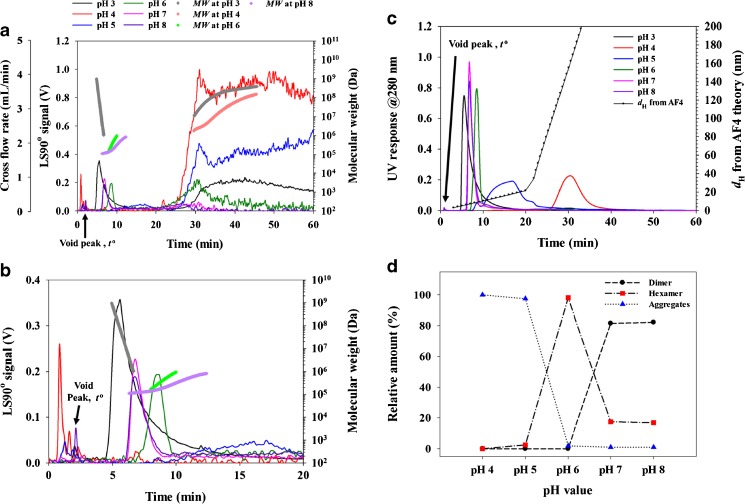
Fig. 4.
AF4-MALS-UV fractograms of LbGadB obtained at various pH. The injection volume was 200 μL at pH 3 and 4 and 150 μL at pH 5, 6, 7, and 8. a LS fractogram at 90° and MW. b Enlargement of fractogram shown in a. c UV fractogram at 280 nm and d H from AF4 theory. d Relative amount of dimer, hexamer, and aggregates of LbGadB measured from peak area of deconvoluted UV fractograms

