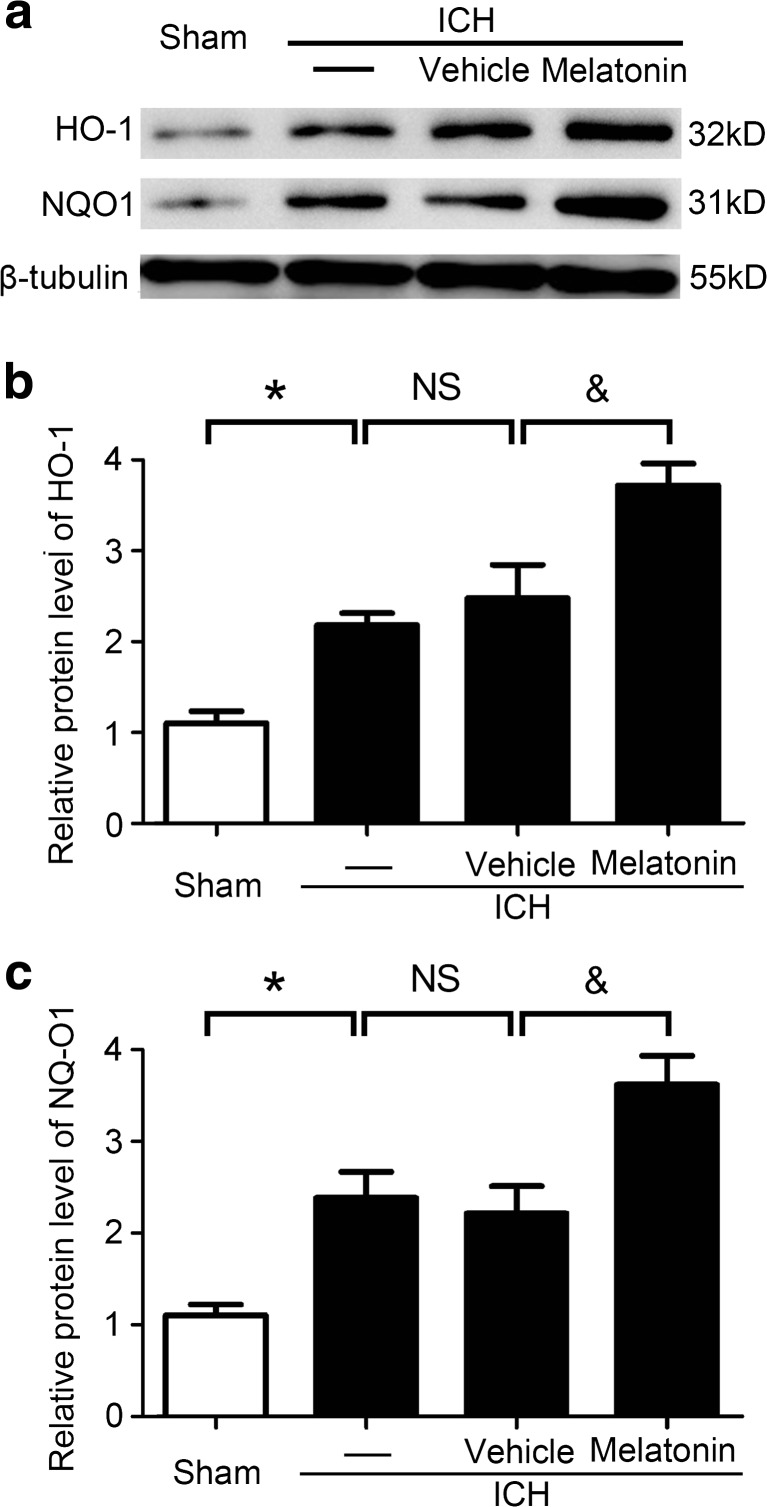
Fig. 7.
Melatonin increased antioxidant indicator expressions in brain tissues at 72 h after ICH. a Western blot analysis displayed the expressions of HO-1 and NQO1 in the sham, ICH, ICH + vehicle, and ICH + melatonin groups. Relative HO-1 (b) and NQO1 (c) levels were calculated based on densitometry analysis. The mean values of the HO-1 and NQO1 within the sham group were normalized to 1.0. All data are displayed as mean ± SEM, with *P < 0.05 and & P < 0.05 deemed as significant difference; NS, no significant difference, n = 6

