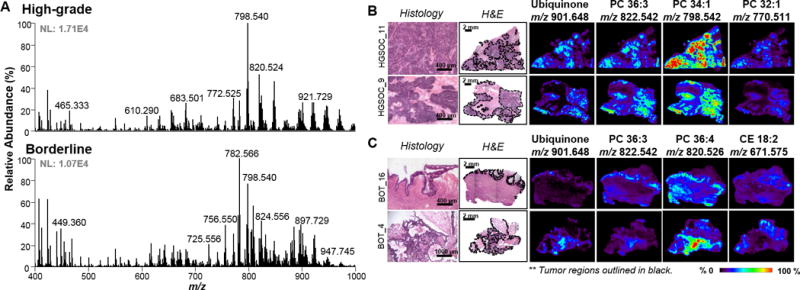
Figure 2.

Analysis by DESI-MSI in the positive ion mode. A) Representative metabolic profiles for high-grade SOC and serous borderline. Top: High-grade. Bottom: Borderline B) Representative ion images for high-grade SOC tissue samples. C) Representative ion images for borderline tumor samples. Tumor areas are outlined in black on H&E slides. Areas of red intensity within the ion images represent highest (100%) and black lowest (0%) relative abundances. Adjacent tissue sections were used for negative and positive ion mode analysis. PC: glycerophosphocholine CE: cholesteryl ester. Lipid species are described by number of fatty acid chain carbons and double bonds.
