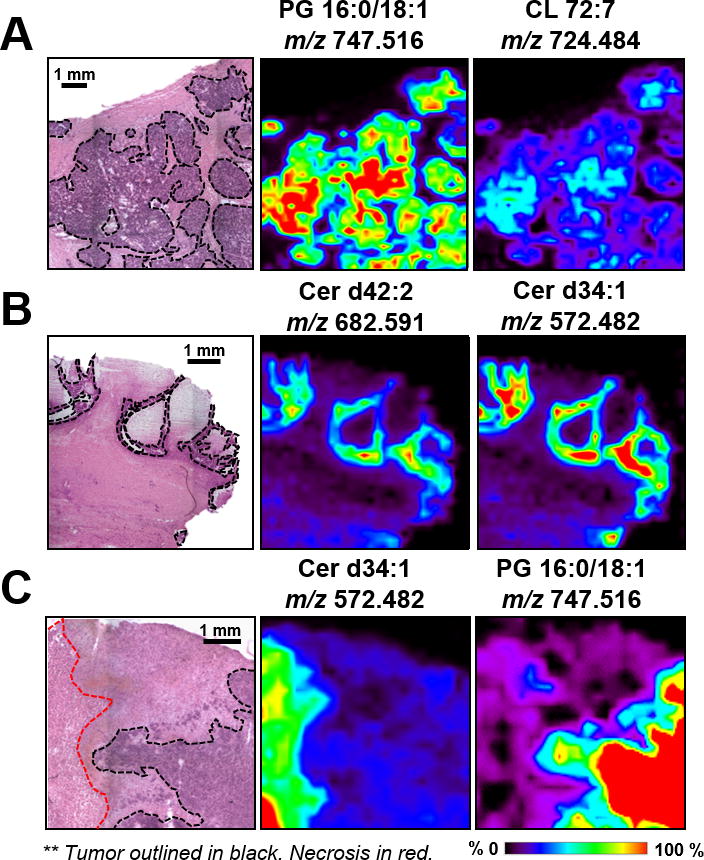
Figure 3.

Magnified regions for samples A) HGSC_11 B) BOT_16 C) HGSC_1; with selected ion images that correlate to and outline the presented histological heterogeneities. PG: glycerophosphoglycerols. Cer: Ceramide. Lipid species are described by number of fatty acid chain carbons and double bonds. The tumor areas are outlined in black, necrotic areas in red. Areas of red intensity within the ion images represent highest (100%) and black lowest (0%) relative abundances.
