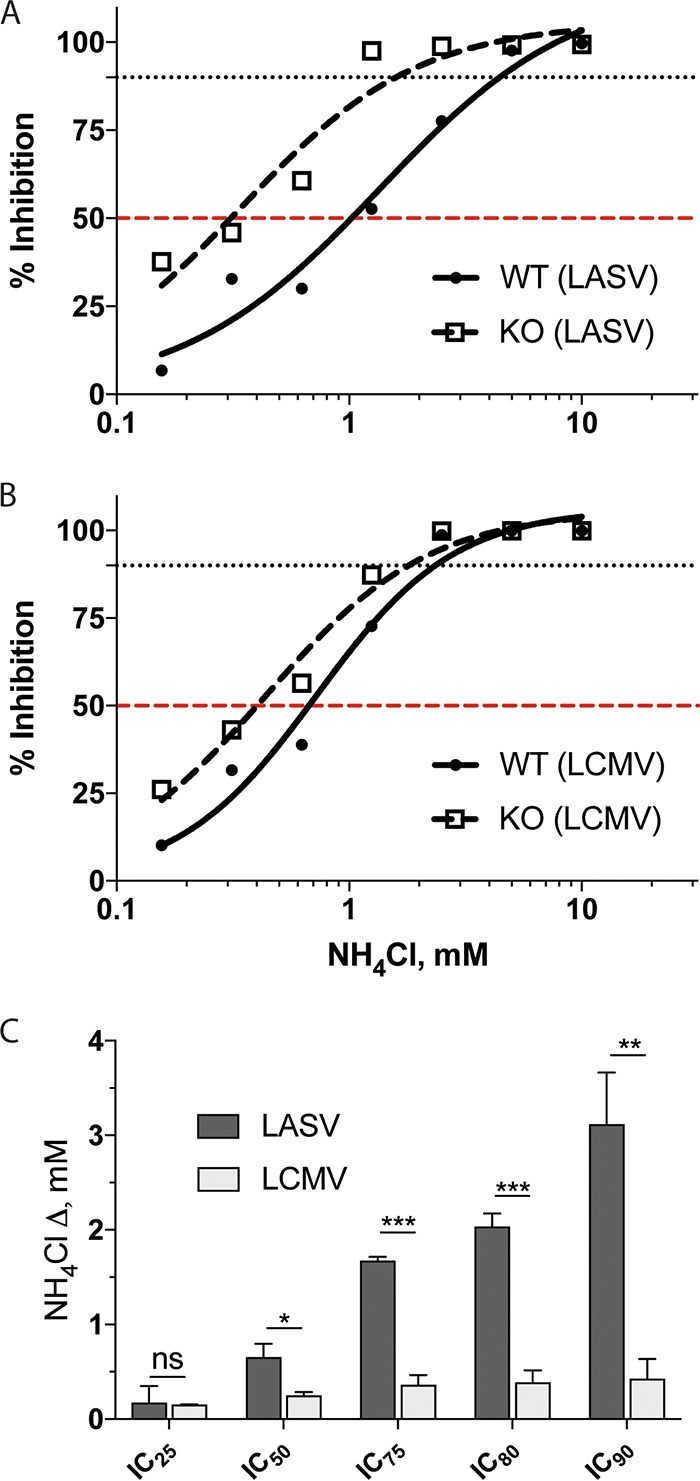
FIG 7 .

Dose responses of LASV and LCMV GPC-mediated infection to NH4Cl in cells ± Lamp1. WT (solid lines, filled circles) and KO (dashed lines, empty boxes) cells were pretreated with NH4Cl at the indicated concentrations. Cells were then infected in triplicate with (A) LASV or (B) LCMV MLV pseudoviruses (titer determined for ~75,000- to 100,000-RLU signal in mock-treated WT cells). At 24 hpi, cells were lysed and analyzed for firefly luciferase activity. Infection signal was normalized to mock-treated cells, converted to inhibition values, and fitted to a sigmoidal dose-response curve. 50% and 90% inhibition are indicated by red and black dashed lines, respectively. Data shown in panels A and B are from a single experiment that was performed two additional times with similar results. In panel C, the average differences between inhibitory NH4Cl concentrations for LASV and LCMV in WT and KO cells from the three experiments are shown (ΔmM = ICWT − ICKO). See Table 1 for details. *, P < 0.05; **, P < 0.01; and ***, P < 0.001.
