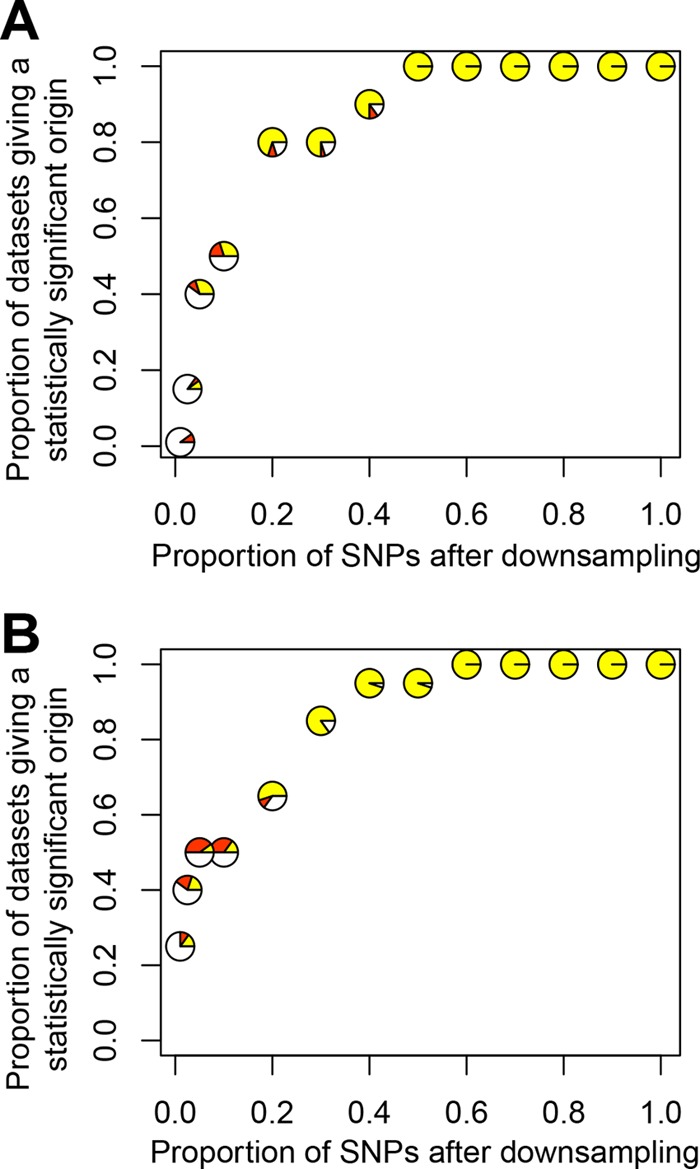
FIG 3 .

Power analysis of signatures of range expansion. USA300-NAE SNPs were randomly downsampled to make 20 new data sets for each bin of downsampled SNPs and tested for a significant origin by using the signature of a decrease in θπ (panel A) or an increase in Ψ (panel B). Yellow represents those data sets giving a significant origin in the Pennsylvania region (i.e., Pennsylvania, Ohio, New York, or Massachusetts), red represents any other significant origin, and white represents a nonsignificant origin.
