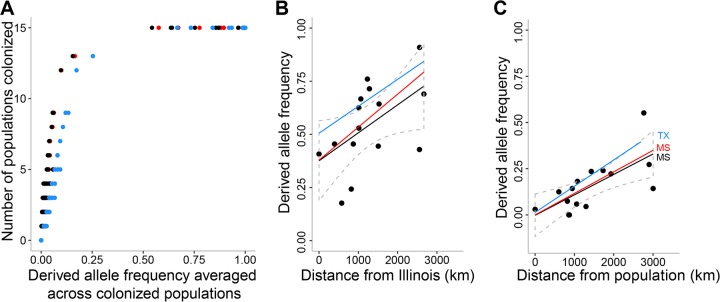
FIG 4 .
Identification of well-sampled derived alleles of USA300-NAE. Panel A shows the relationship between the frequency of derived alleles and the number of colonized populations when all isolates (from 2001 to 2011; black dots), recent isolates (from 2007 to 2011; red dots), or all isolates with allele frequencies binned into one of five 20% bins before averaging across populations (blue dots) were used. Panels B and C show the significant positive frequency gradients for the gyrA and ssa-1 alleles, respectively. The data points, regression lines, and 95% confidence intervals are shown for all isolates (in black) along with the regression lines for recent isolates (red lines) and for all isolates with binned allele frequencies (blue lines). The different origin populations giving the best correlation with the different analyses are indicated in panel C.

