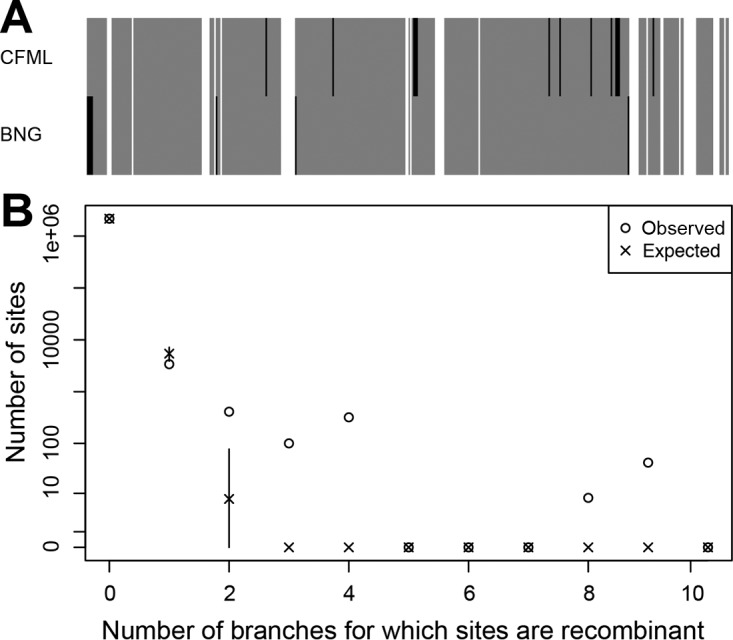
FIG 5 .

Recombination in USA300. Panel A shows 4,109 biallelic SNPs in columns and results of recombination analysis by CFML and BNG in rows. Gray columns indicate nonrecombinant SNPs according to both methods. White columns indicate recombinant SNPs according to both methods. Black columns indicate recombinant SNPs according to one method only. Panel B shows the distribution of the number of branches for which sites are recombinant as inferred by CFML (○) and as expected under the CFML model (×). In panel B, 95% confidence intervals are shown but the intervals are sometimes too small to be visible and sometimes the symbols for observed and expected results overlap.
