
Figure 3.
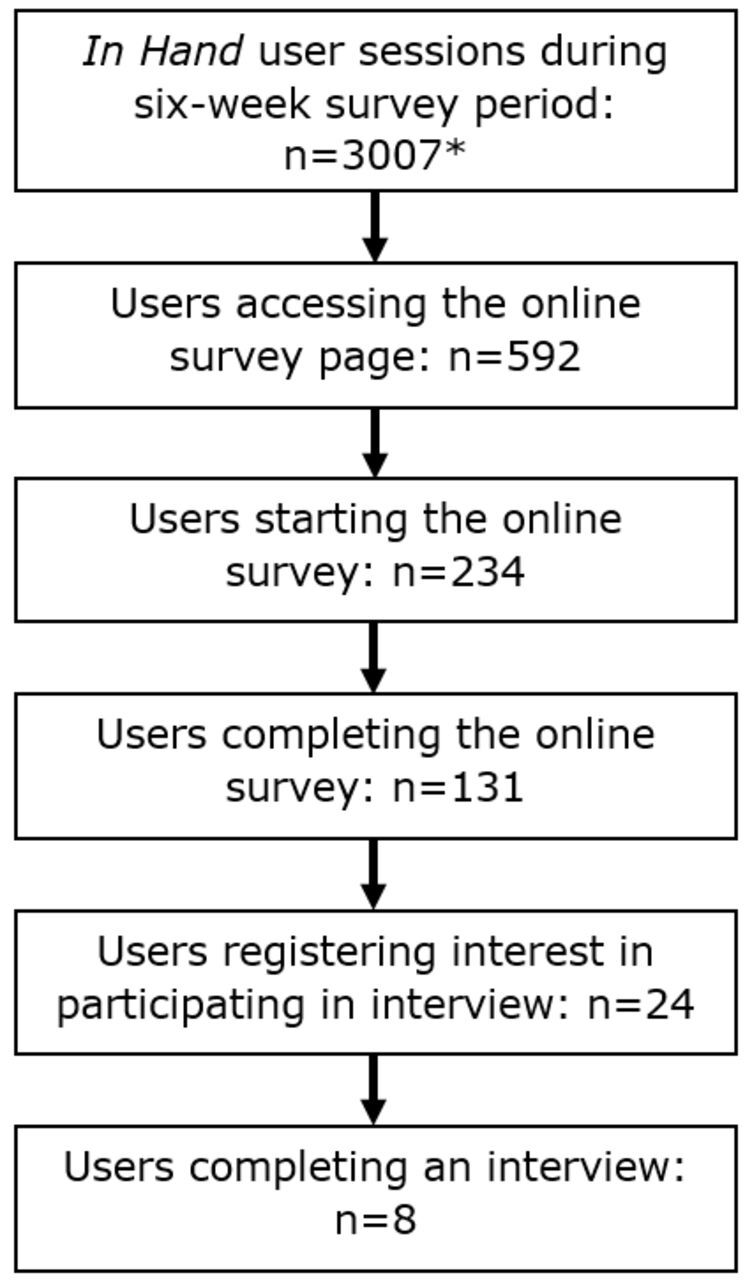
Diagram outlining number of user sessions (*does not necessary reflect individual users, but the number of individual sessions) and the flow of participants during the study.
Official websites use .gov
A
.gov website belongs to an official
government organization in the United States.
Secure .gov websites use HTTPS
A lock (
) or https:// means you've safely
connected to the .gov website. Share sensitive
information only on official, secure websites.
Diagram outlining number of user sessions (*does not necessary reflect individual users, but the number of individual sessions) and the flow of participants during the study.