
Figure 1.
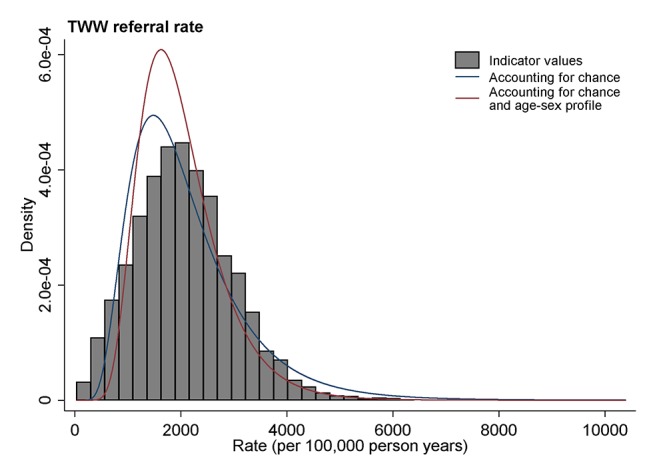
Illustration of the distribution of a diagnostic process indicator (2-week wait referral) for general practices. Observed values are denoted in grey histogram bars. The distribution of underlying practice activity, accounting for chance, is denoted with a blue curve line. The distribution of underlying practice activity adjusting for age-sex differences in practice populations is denoted by a red curve line. TWW, two-week wait.