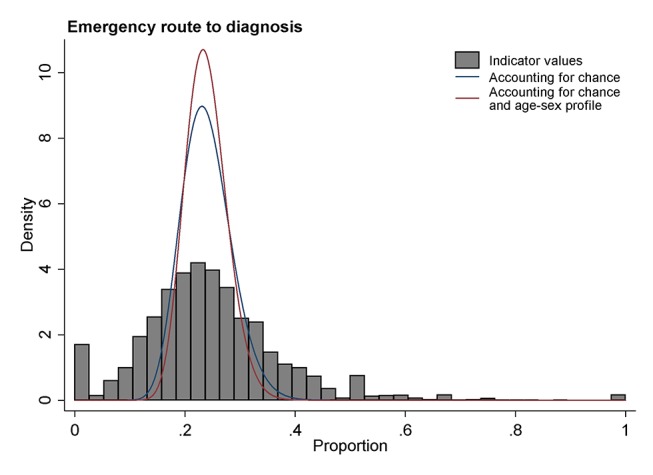
Figure 2.

Illustration of the distribution of a diagnostic outcome indicator (per cent of cancer cases diagnosed following an emergency presentation) for general practices. Observed values are denoted in grey histogram bars. The distribution of underlying practice activity, accounting for chance, is denoted with a blue curve line. The distribution of underlying practice activity adjusting for age-sex differences in practice populations is denoted by a red curve line.
