


Figure 2.
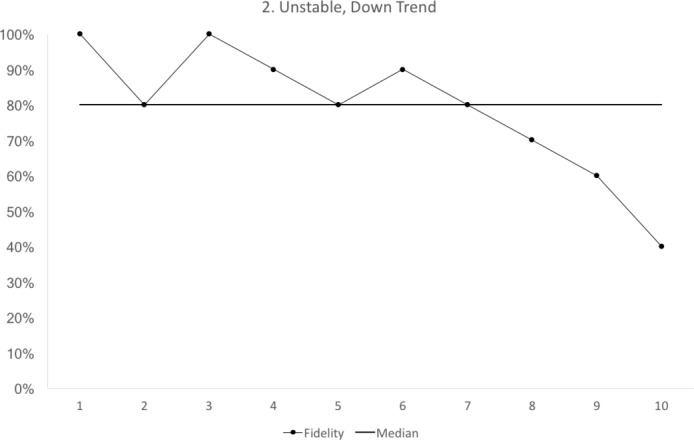
Run chart 2 shows a median fidelity above 70%, but the run chart is not stable. There is a downward trend starting with cycle 6. Each data point represents 10 observations.
Official websites use .gov
A
.gov website belongs to an official
government organization in the United States.
Secure .gov websites use HTTPS
A lock (
) or https:// means you've safely
connected to the .gov website. Share sensitive
information only on official, secure websites.
Run chart 2 shows a median fidelity above 70%, but the run chart is not stable. There is a downward trend starting with cycle 6. Each data point represents 10 observations.