Figure 2.

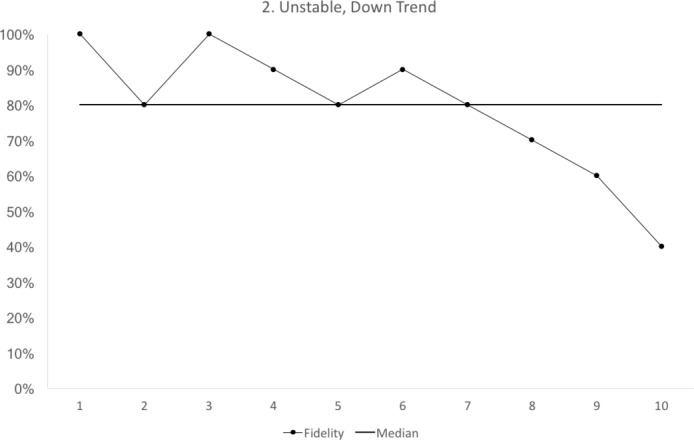
Run chart 2 shows a median fidelity above 70%, but the run chart is not stable. There is a downward trend starting with cycle 6. Each data point represents 10 observations.

Run chart 2 shows a median fidelity above 70%, but the run chart is not stable. There is a downward trend starting with cycle 6. Each data point represents 10 observations.