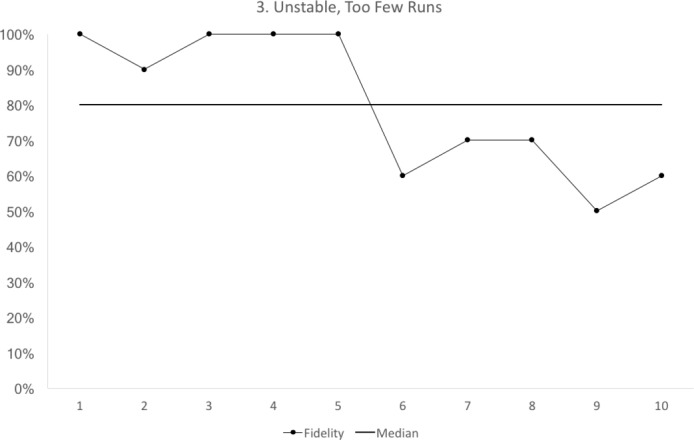
Figure 3.

Run chart 3 shows a median fidelity above 70%, but the run chart is not stable. The run chart line crosses the median only once. For a run chart where there are 10 points that do not fall on the median, we would expect to see the median crossed at least three times8. Each data point represents 10 observations.
