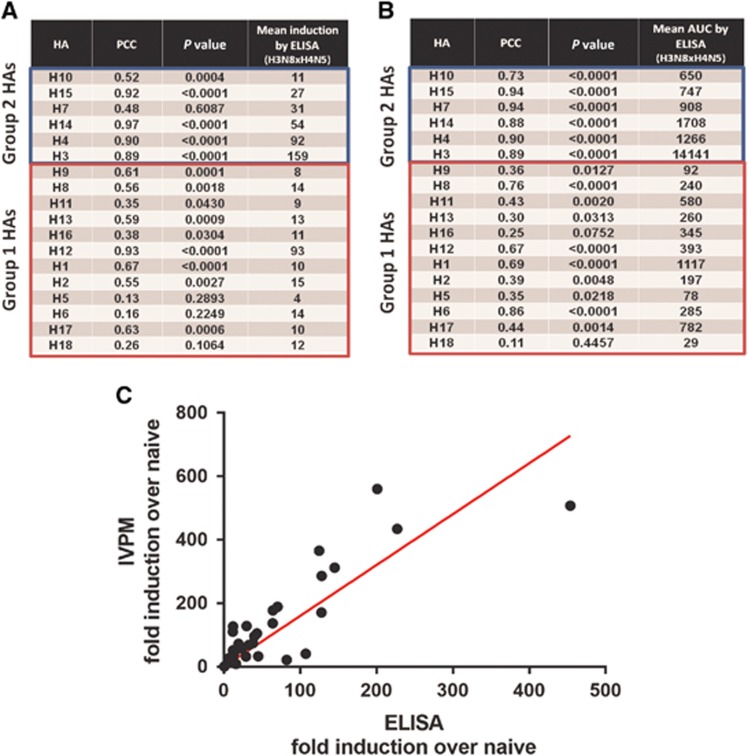
Figure 4.
Correlation analysis of reactivity data measured by IVPM and ELISA. Correlation between IVPM and ELISA fold induction over naive sera (A) and IVPM and ELISA absolute AUC values (B) are shown, by HA. Correlation of ELISA and IVPM fold induction data for recombinant H3 shown as an example of the correlation analysis (C). area under the curve, AUC; enzyme-linked immunosorbent assay, ELISA; hemagglutinin, HA; influenza virus protein microarray, IVPM.

