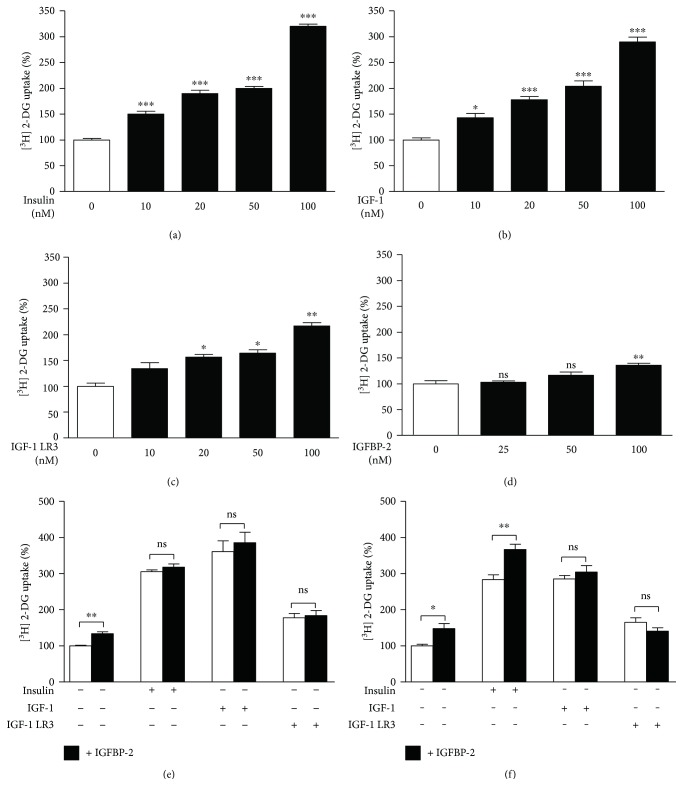
Figure 1.
Effects of IGFBP-2 on insulin and IGF-1-stimulated glucose uptake in 3T3-L1 adipocytes. (a–d) Dose-dependent effects of insulin, IGF-1, IGF-1 LR3, and IGFBP-2 on glucose uptake in 3T3-L1 adipocytes. ∗P < 0.05, ∗∗P < 0.01, and ∗∗∗P < 0.001 versus control. (e and f) Effect of IGFBP-2 (100 nM) (black bars) on basal and insulin (20 nM), IGF-1 (20 nM), and IGF-1 LR3 (20 nM)-induced glucose uptake (white bars) after short- and long-term incubations. ∗P < 0.05 and ∗∗P < 0.01. Each experiment was performed with three technical replicates and total number of experiments was three. The glucose uptake values are percentage of the controls. The results are presented as mean ± SEM.

