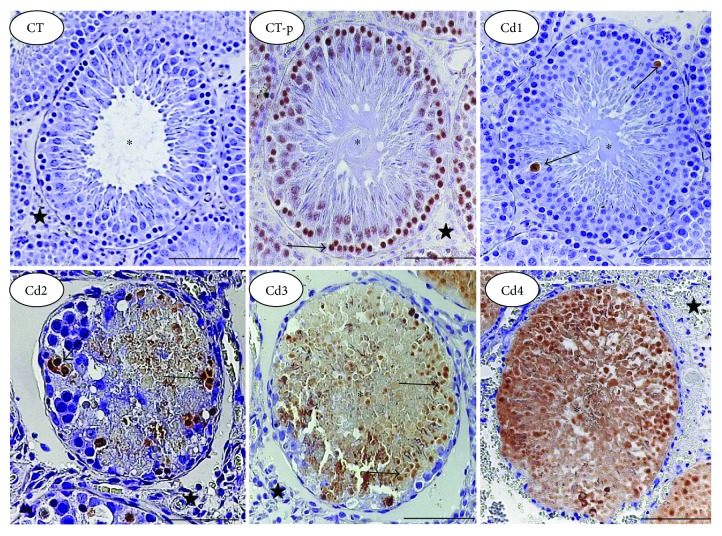
Figure 3.
Distribution of apoptotic cells in the testes of control rats and those exposed to cadmium (Cd) (TUNEL technique, bars = 100 μm). Control (CT): 0.9% saline; CT-p (positive control for the TUNEL technique): 1.00 U/mL DNase I; Cd1: 0.67 mg Cd/kg; Cd2: 0.74 mg Cd/kg; Cd3: 0.86 mg Cd/kg; and Cd4: 1.1 mg Cd/kg. Cells with brown nuclei show positivity for apoptosis (arrows). Asterisks: seminiferous tubules; star: intertubular compartment.

