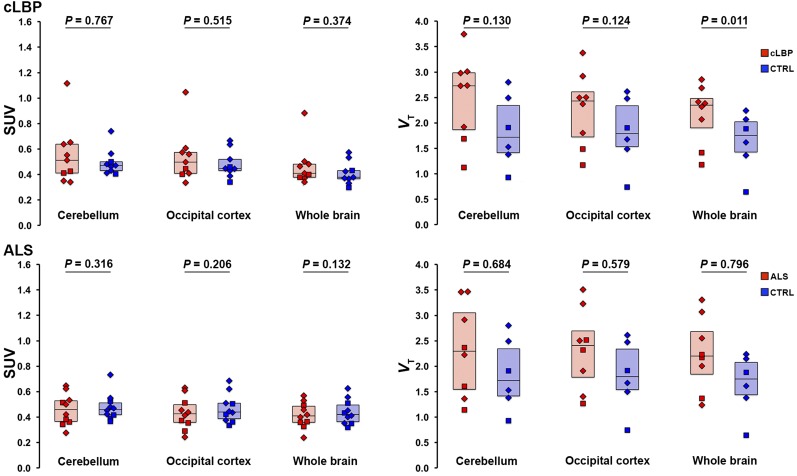
FIGURE 1.
Group comparison of SUV (left) and VT (right) from candidate pseudoreference regions evaluated in this work. Boxes represent 25%–75% interquartile range; horizontal line represents median. Diamonds represent subjects with the high-affinity TSPO genotype (Ala/Ala in the TSPO polymorphism); squares represent subjects with mixed-affinity genotype (Ala/Thr). CTRL = control.

