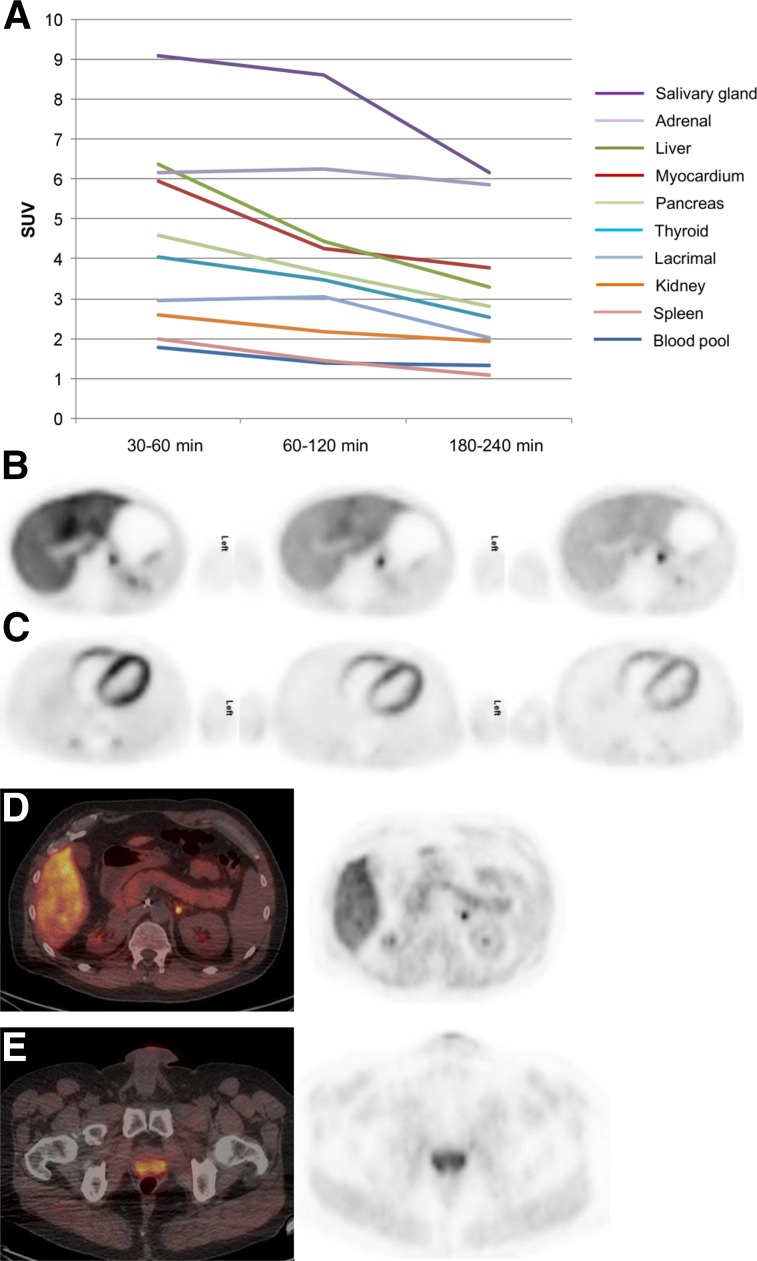
FIGURE 3.
Uptake in normal organs at various scan times after injection. (A) Uptake decreases from scan 1 (0.5–1 h after injection) to scan 2 (1–2 h after injection) and scan 3 (3–4 h after injection). (B) Prominent activity is seen in liver, which decreases over time. Focal uptake posteromedially is uptake along adrenal (SUV 5.6). (C) Cardiac activity is most prominent in early images, decreasing with time; distribution is seen along the ventricular myocardium. (D) Diffuse uptake is seen along pancreas (SUV 3.5); posteromedial uptake is physiologic uptake in adrenal gland. (E) Uptake is seen in prostate (SUV 5.6).

