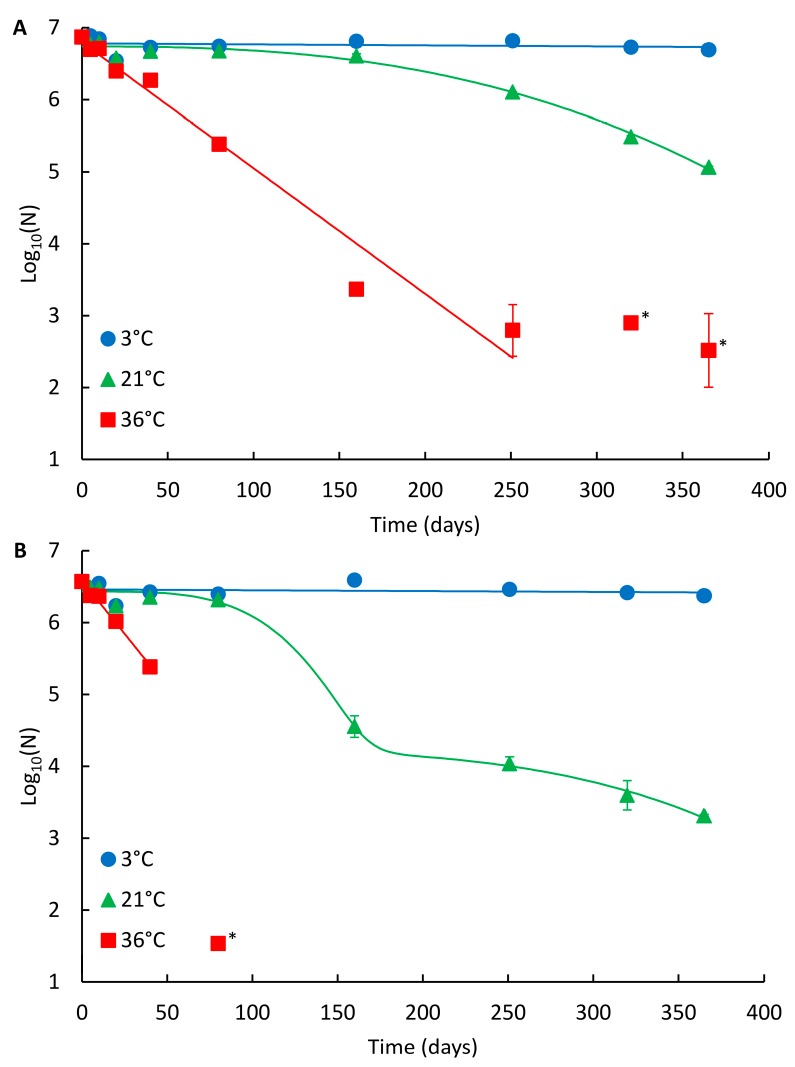
Figure 1.
Persistence of the NoV genome in drinking water at different temperatures. (A) NoV GII_A and (B) NoV GII_B. Identified curves represent the modelled decay of best fit. At 3 °C and 36 °C, log-linear modelled curves are presented, and at 21 °C Weibull and double Weibull modelled curves for GII_A and GII_B are shown, respectively. Error bars show the standard deviation for duplicate extractions. Below limit of quantitation (LOQ) results are shown with an asterisk (*), but not fitted in curves.

