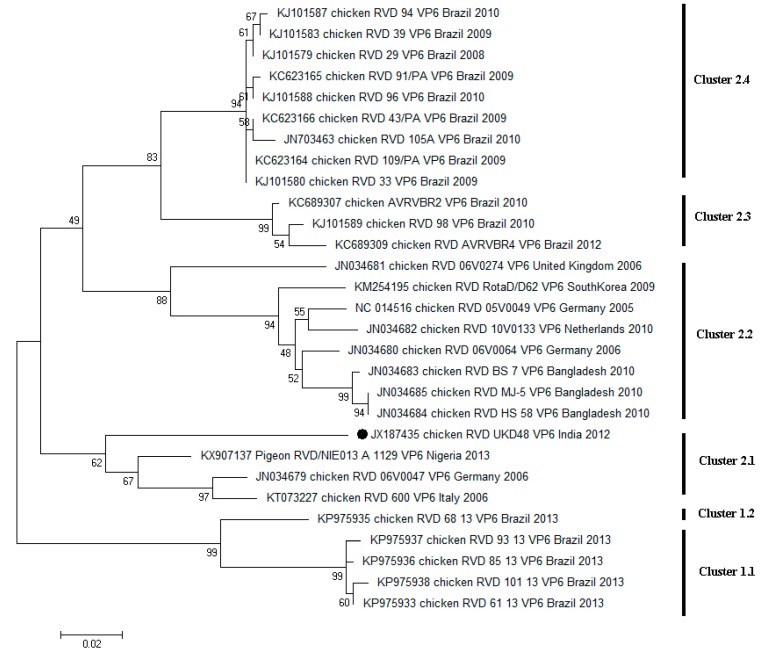
Figure 4.
Dendrogram of the RVD VP6 gene constructed with maximum likelihood method based on the Tamura 3-parameter model. A discrete Gamma distribution was used to model evolutionary rate differences among sites. The strain (UKD48) analyzed in the study is shown with a black circle mark. Bootstrap values below 50 have been omitted. The tree is drawn to scale length representing 0.02 nucleotide substitutions per site.

