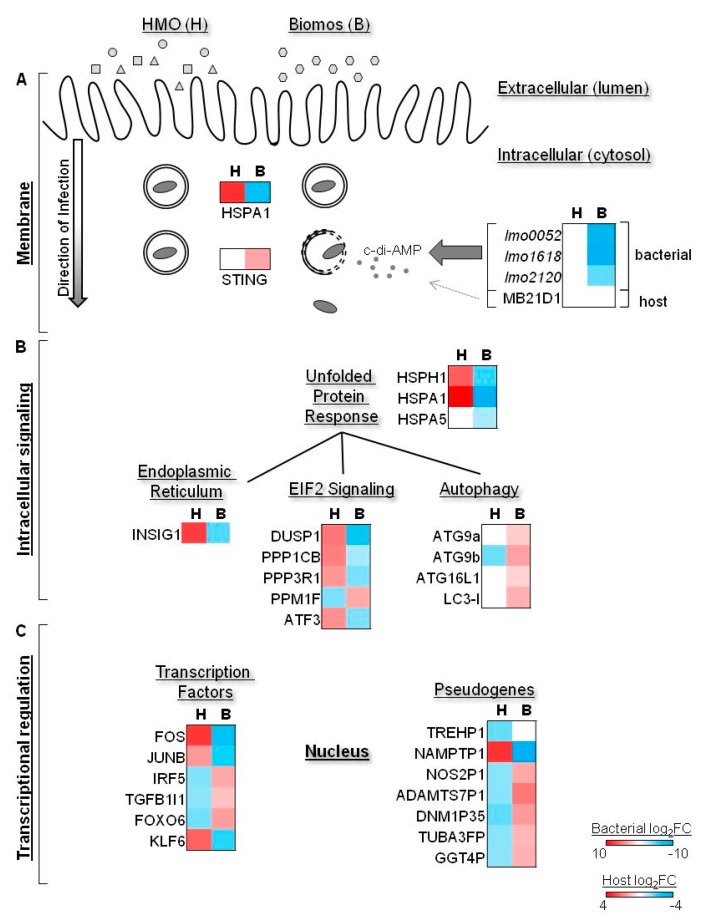
Figure 4.
Differential canonical pathway expression during infection in the presence of prebiotic oligosaccharides. Differential expression (log2FC) of individual genes visualized by heat map. Bacterial differential expression ranges from −10 < log2FC < 10; host differential expression ranges from −4 < log2FC < 4. HMO/+Lm is indicated as “H”; Biomos/+Lm is indicated as “B.” HMO is indicated by squares, triangles and circles above the membrane; Biomos is indicated by the hexagons above the membrane. (A) Differential subcellular localization is indicated by the intact double circle (H, vacuole associated) versus the dotted line double circle (B, vacuolar escape). c-di-AMP synthesis, transport and degradation genes are listed with arrow weights indicating host vs. bacterial contribution to cytosolic c-di-AMP. (B) Differential expression of signaling pathways with prebiotic treatment. (C) Differential expression of transcription factors and pseudogenes with prebiotic treatment.

