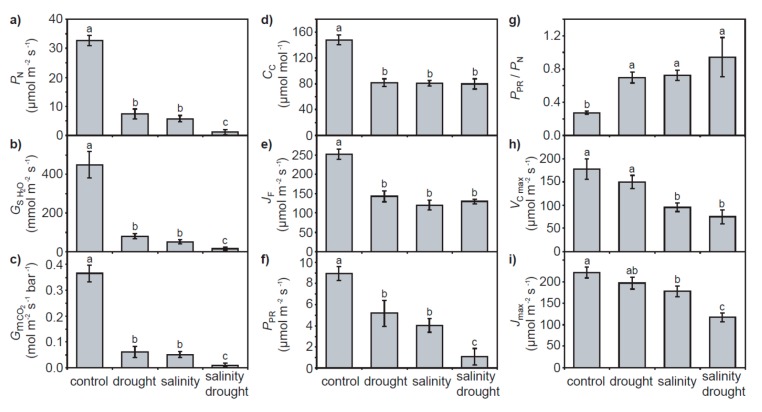
Figure 2.
Photosynthetic parameters of quinoa subject to the control, drought, salinity and salinity–drought treatments: (a) photosynthesis; (b) stomatal conductance to water vapor; (c) mesophyll conductance to CO2; (d) concentration of [CO2] within the chloroplast envelope; (e) electron transport; (f) photorespiration; (g) ratio of photorespiration to photosynthesis; (h) the maximum carboxylation rate of RubisCO, and; (i) the maximum rate of electron transport for regeneration of RuBP. Error bars indicate one standard deviation either side of the mean. Letters indicate significant difference using a one-way ANOVA and an LSD post hoc test.

