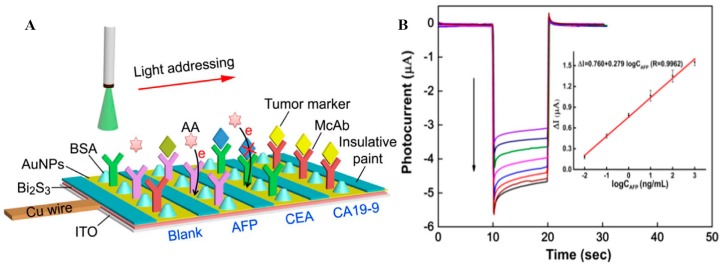
Figure 7.
(A) Schematic representation for the rapid detection of multiple biomarkers on a single PEC sensor. (B) Photocurrent responses and calibration plot (inset) of AFP detection at concentrations of 1000, 100, 10, 1.0, 0.1, 0.01, 0.005, and 0 ng mL−1 (from top to bottom). Reproduced from [59] with permission from Elsevier.

