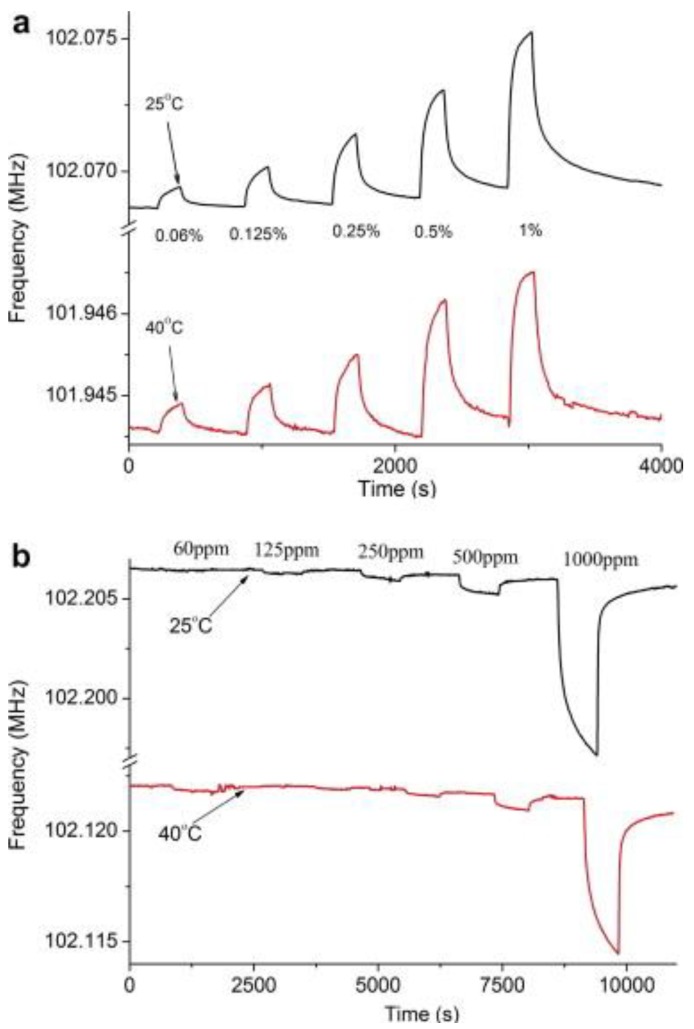
Figure 7.
(a) Sensor response of graphene nanosheets integrated with LiTaO3 SAW device on H2 exposure showing an increase in frequency (b) Sensor response for CO showing drop in frequency, the measurements for both gases were carried out at 25 °C and 40 °C respectively. Adapted with permission from [105], copyright (2008) Elsevier.

