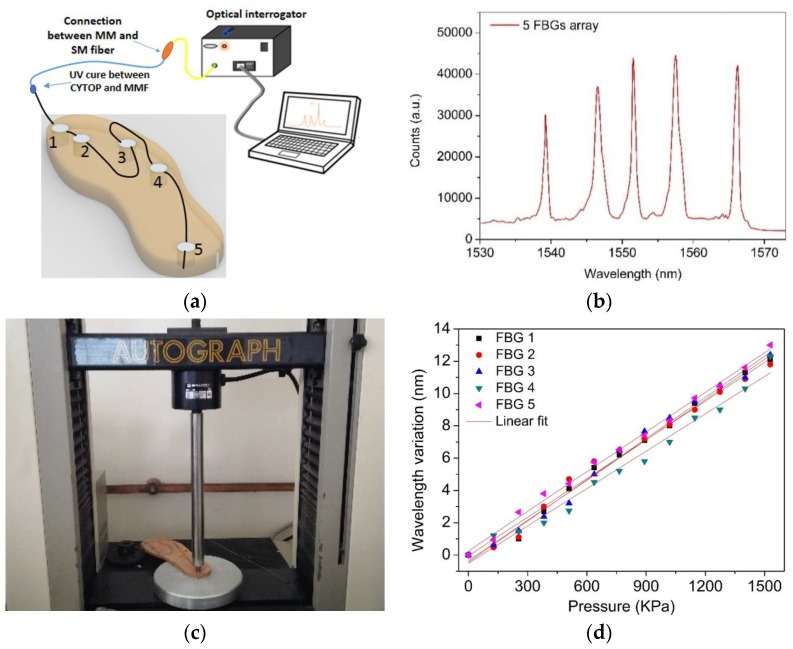
Figure 3.
(a) Schematic representation of the monitoring system. (b) Reflected optical spectrum of the five-sensor FBG array after integrated in the cork insole; (c) photograph of the pressure testing platform with the cork insole; (d) calibration results of the POFBGs to pressure (points are the experimental values and lines refer to the linear fits, (0.982 < R2 < 0.994).

