
Fig. 5.
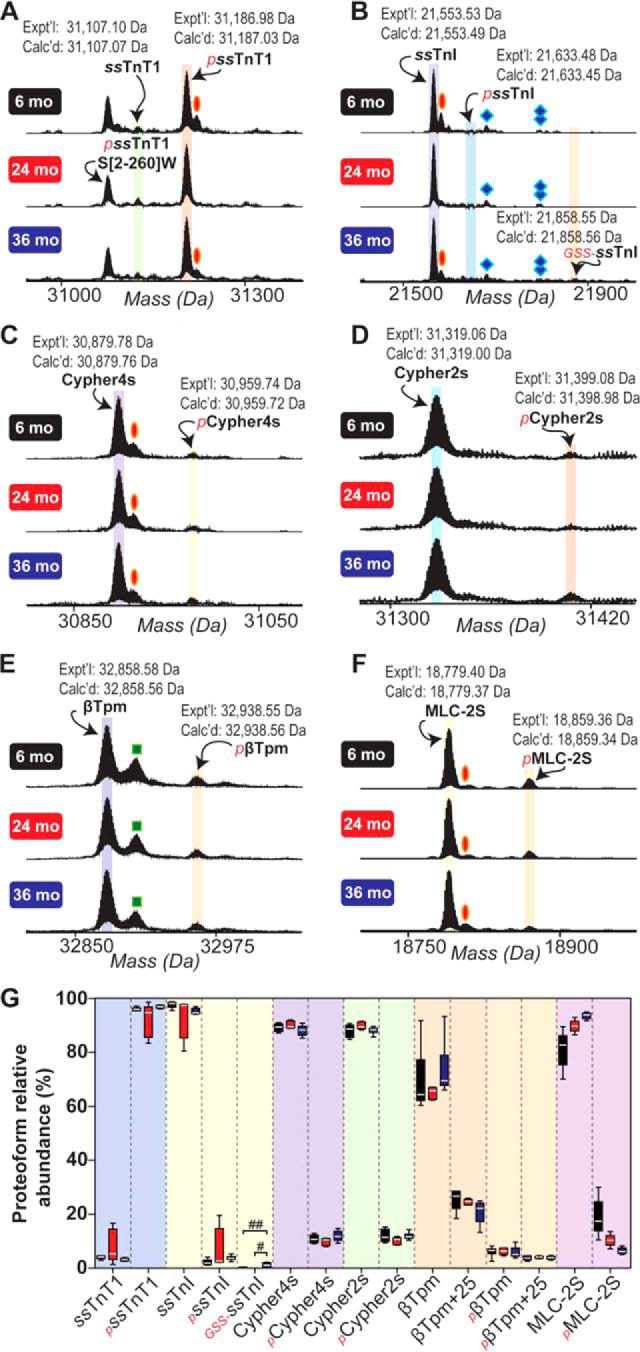
Top-down high-resolution MS-based quantification of sarcomeric protein proteoform relative abundances in slow-twitch SOL muscles isolated from 6-, 24-, and 36-month-old rats. Representative mass spectra showing ssTnT1 (A), ssTnI (B), Cypher4s (C), Cypher2s (D), βTpm (E), and MLC-2S (F). Oval, diamond, double diamond, and square represent peaks corresponding to oxidation, protein associated non-covalently with one TFA molecule, protein associated non-covalently with two TFA molecules, and a proteoform exhibiting a mass difference of +25 Da versus βTpm, respectively. G, Graph showing the relative quantification of proteoform relative abundances in SOL muscles isolated from rats in different age groups. Quantification is based on n = 6 animals for all age groups. Expt'l, experimentally determined relative molecular mass. Calc'd, calculated relative molecular mass based on sequence in the UniProtKB/Swiss-Prot database. #p < 0.001; ##p < 0.0001.