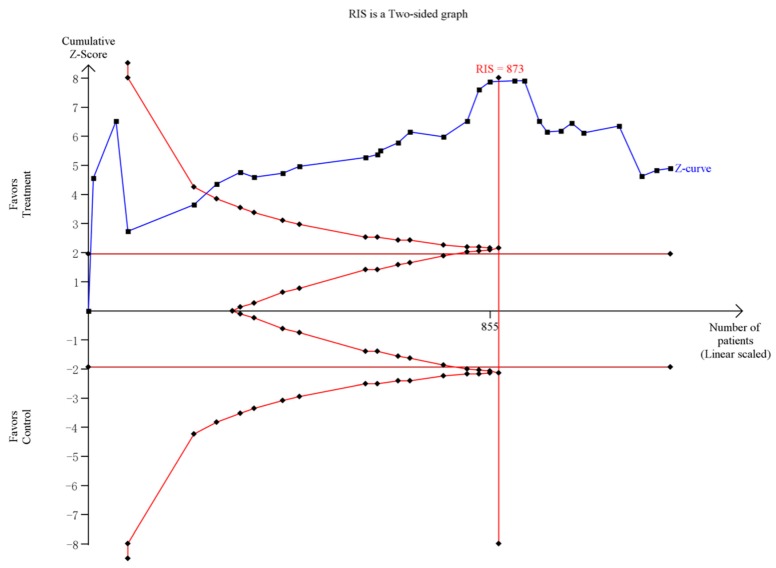
Figure 5.
Trial sequential analysis of efficacy of group counseling program on Internet addiction level. The blue line represents the cumulative Z-score of the meta-analysis. The straight red represents the conventional p = 0.05 statistical boundaries. The inward sloping red lines represent the truncated trial sequential monitoring boundaries.

