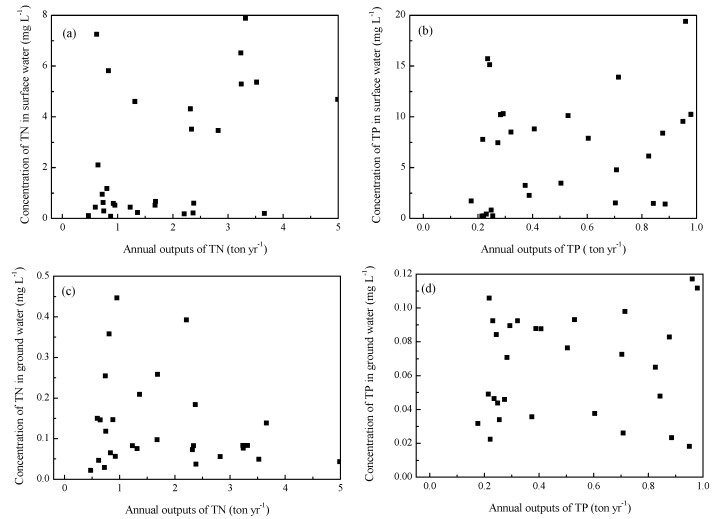
Figure 5.
The concentrations of TN and TP in surface and ground water response to the annual outputs of pollutants from pig farms. (a) The relationship between annual outputs of TN and concentration of TN in surface water (b) The relationship between annual outputs of TP and concentration of TP in surface water (c) The relationship between annual outputs of TN and concentration of TN in ground water (d) The relationship between annual outputs of TP and concentration of TP in ground water.

