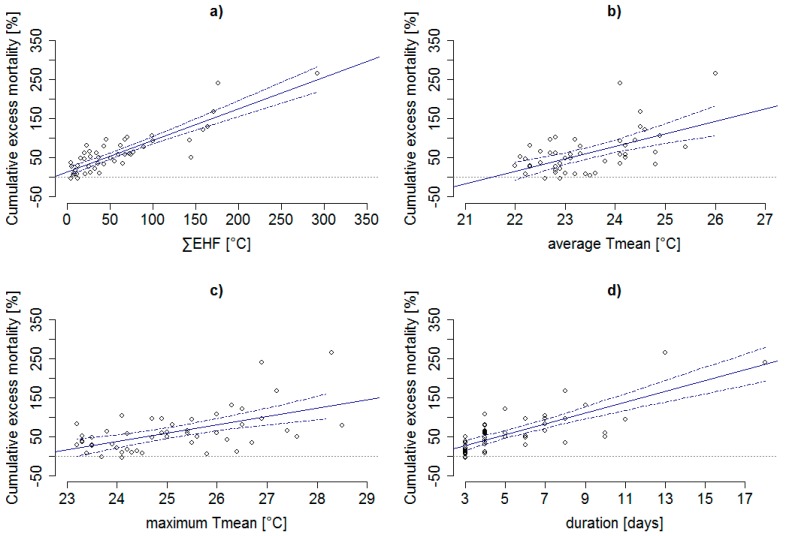
Figure 4.
Relationship between cumulative excess mortality for the whole population and (a) cumulative excess heat factor (∑EHF), (b) average daily mean temperature (average Tmean), (c) maximum daily mean temperature (maximum Tmean), and (d) duration of heat waves, during 1994–2015 in the Czech Republic. Dash-dotted lines indicate 95% confidence interval of the regression line. Slopes of the fitted regression lines are presented in Table 3.

