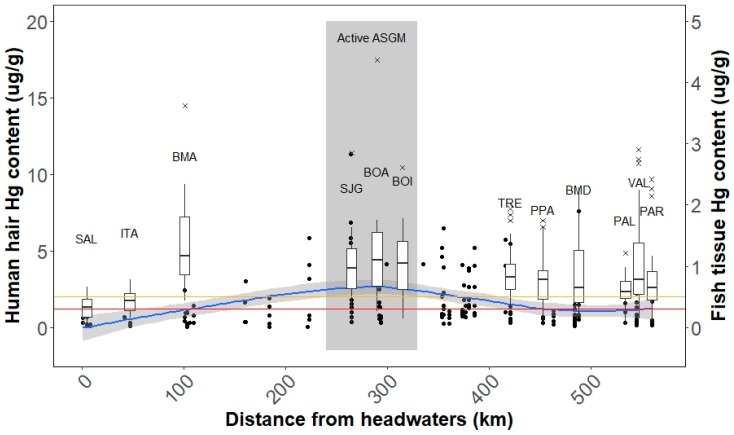
Figure 2.
Total mercury content (µg/g) of human hair (left y-axis) and wet weight fish muscle (right y-axis) by location from headwaters along the Madre de Dios River. Boxplots indicate the variation in hair mercury and hair outliers are indicated by “x” symbols. Mercury content in fish tissue was reported previously and is indicated with black circles [46]. A LOESS (locally weighted smoothing) curve (blue line with grey 95% confidence intervals) was added to visualize the relationship between fish tissue mercury for all trophic levels and location along the river. Hair mercury limits for the USEPA (1.2 µg/g, red line) and WHO (2.0 µg/g, yellow line) are also indicated. The grey region indicates communities where intensive active mining is present (240–330 km).

