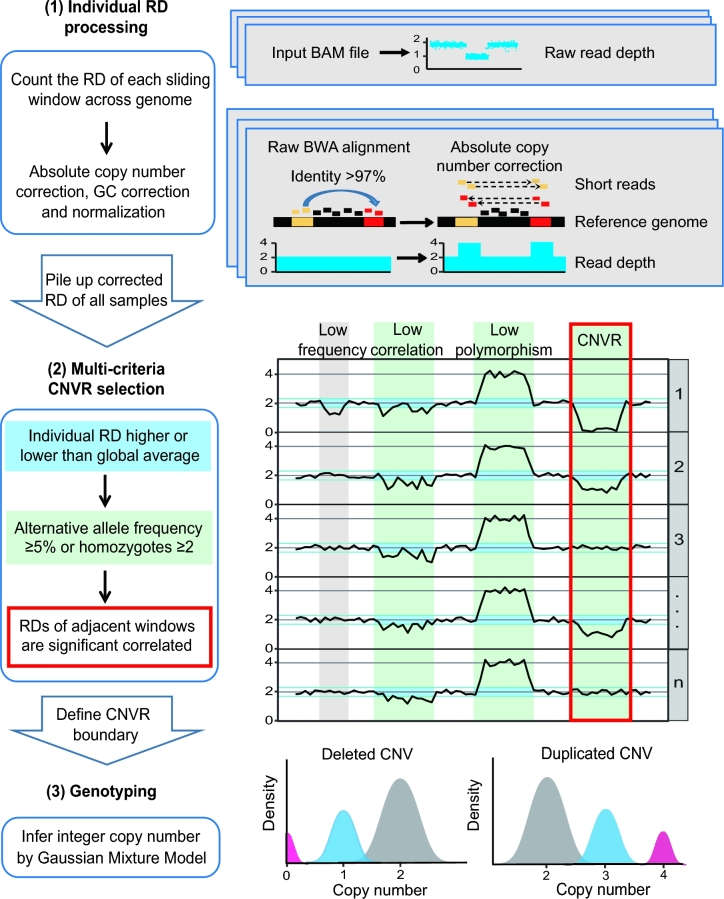
Figure 1:
CNVcaller algorithm flowchart (left) and the key algorithms of each step (right). (1) Individual RD processing. In the absolute copy number correction, the RDs of highly similar windows were added together to deduce the absolute copy number. (2) Multicriteria CNVR selection. The curves show the copy numbers in a specific region for multiple samples. The blue transverse boxes mark the windows with a significant distinguishing copy number from the average (individual criterion). The green vertical boxes indicate that these regions meet the frequency conditions, and the red frame indicates that the RDs between the 2 adjacent windows are significantly correlated (population criteria). The fourth bar from the left, satisfying all the above conditions, is selected as the CNVR. (3) Genotyping: The copy numbers in each CNVR are clustered by a Gaussian Mixture Model to distinguish the normal, heterozygous, and homozygous samples.

