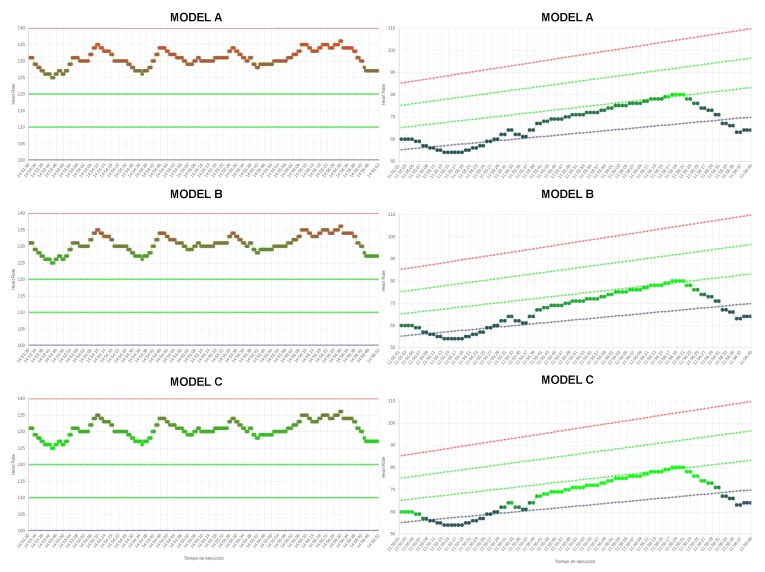
Figure 5.
Impact of the fuzzy modifiers on heart rate streams. Heart rate is plotted using gradually changing colors blue, green, red based on the degree of the terms , respectively. Green dotted lines determine the OHRTZs of patient. Blue and red dotted lines determine aerobic thresholds of the patient, respectively. The impact of the models A, B and C for a case of high–adequate HRs (right); and the impact of the models A, B, and C for a case of low–adequate HRs (left).

