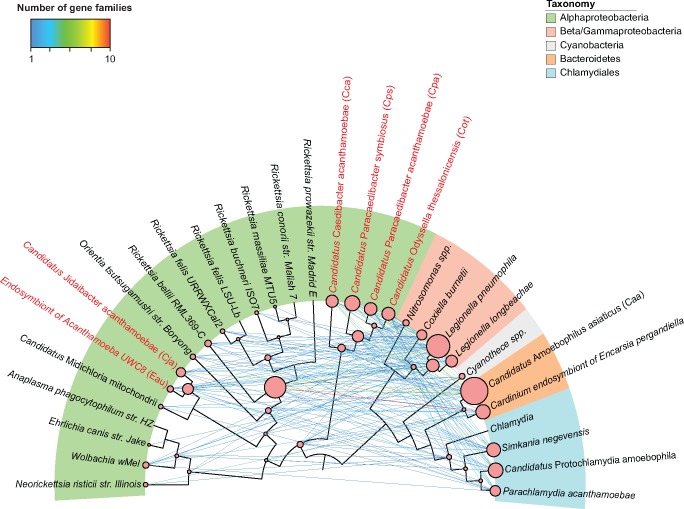
Fig. 2.
—Gene transfer network illustrating LGTs between Rickettsiales and distantly related amoeba-associated bacteria. Each edge represents an LGT route between the two nodes. Edge color corresponds to the number of gene families transferred between the two nodes. The size of the node is proportional to the number of laterally transferred gene families involving the nodes. The six amoeba endosymbionts are highlighted in red.

