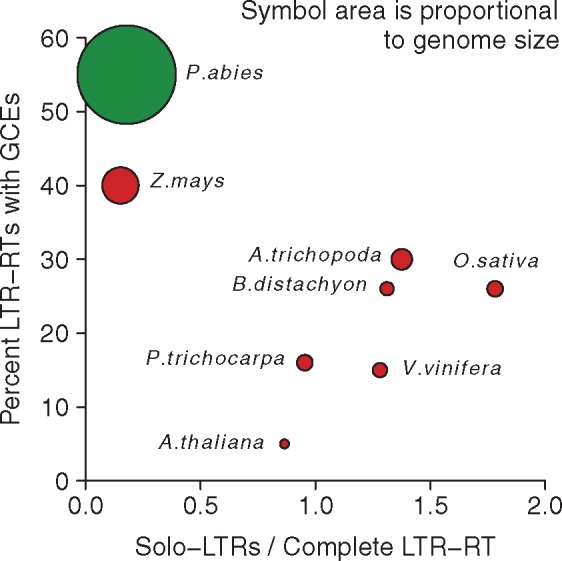
Fig. 5.—

Proportion of examined LTR-RTs with intraelement GCEs between LTRs versus the total ratio of solo-LTRs to complete LTR-RT elements, as a proxy for rates of unequal recombination. Proportion of GCEs shown is for all identified GCEs (equivalent to solid dots in fig. 3). Species are colored as in figure 2 and symbol area is proportional to genome size of each species. The correlation among the six small- to medium-genome species is positive (Spearman’s ρ = 0.841, rs = 0.036) while including the two large-genome species reverses and weakens the correlation to nonsignificance (Spearman’s rs = −0.216, P = 0.61).
