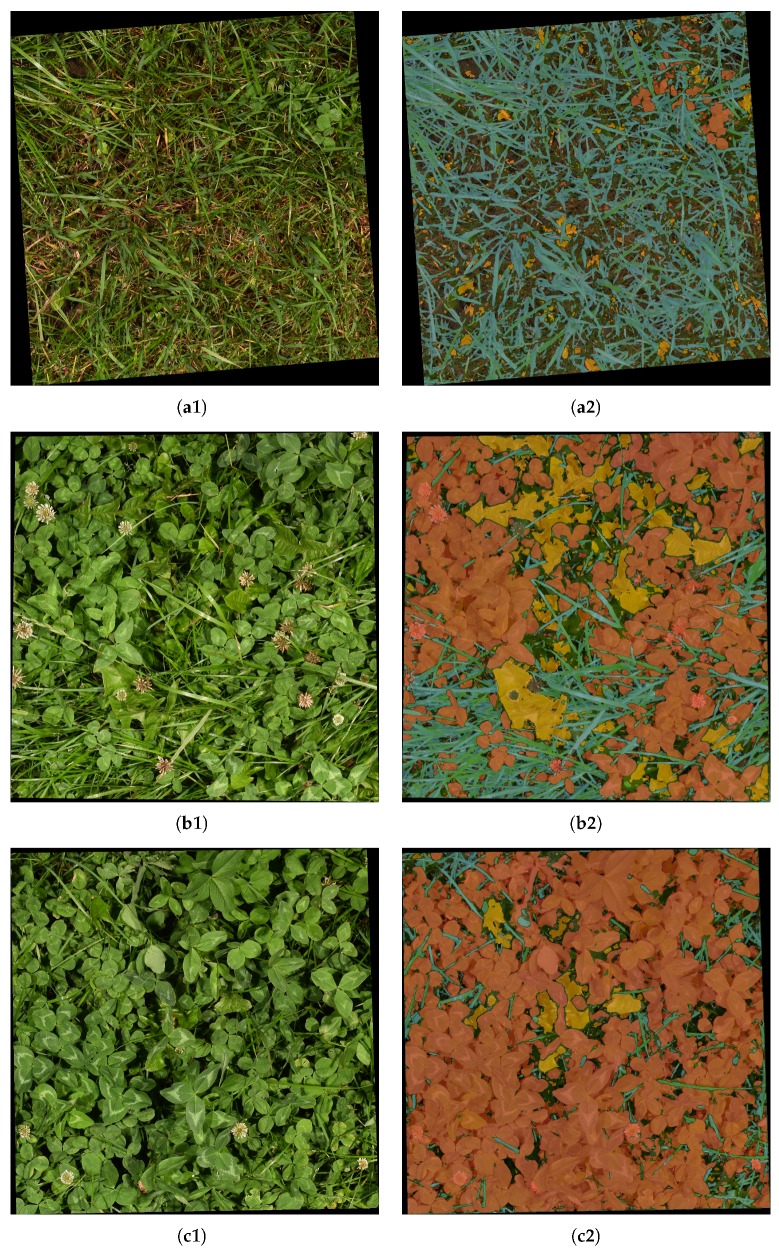
Figure 9.
Visualization of CNN-driven semantic segmentation of highlighted sample pairs from Figure 10. The first column shows the evaluated image. The second column shows the thresholded identification of grass (blue), clover (red), and weeds (yellow) in the image. (a1) Low clover fraction; (a2) Semantic segmentation of (a1); (b1) Medium clover fraction; (b2) Semantic segmentation of (b1); (c1) High clover fraction; (c2) Semantic segmentation of (c1).

