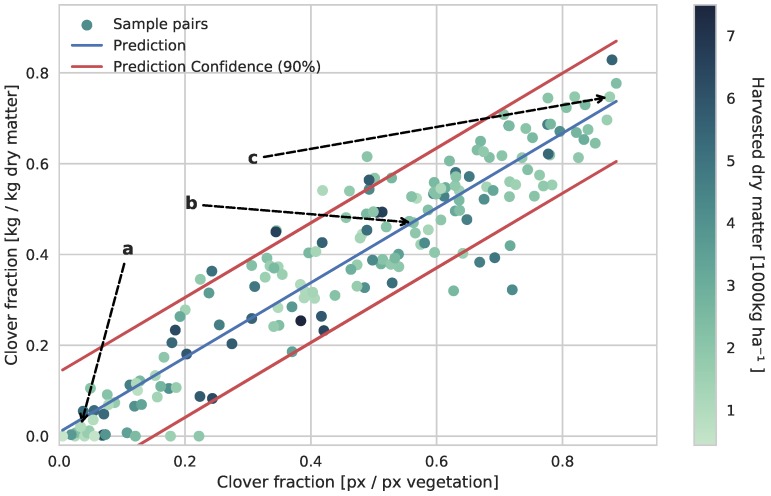
Figure 10.
Comparison and linear regression of the visual clover ratio determined by the CNN and the actual clover ratio in the harvested dry matter at the primary field site. The linear relationship between the visual and dry matter fraction of clover in the sample pairs is clear. The annotations a, b, and c refer to the three image samples shown in Figure 9.

