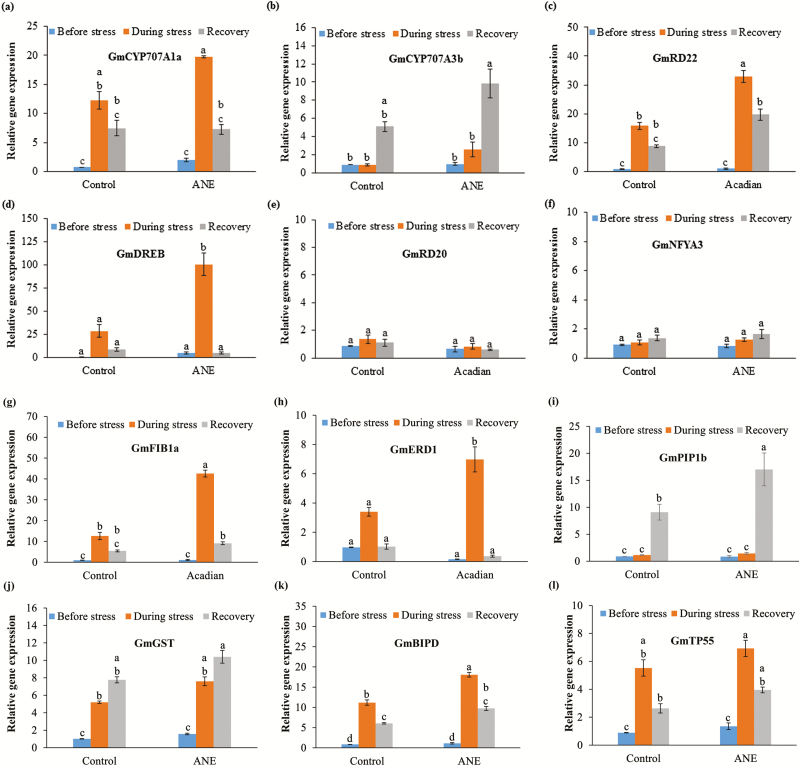
Figure 4.
Effect of ANE on the relative fold expression of genes of selected soybean genes during different stages of drought stress by qPCR: (a) GmCYP707A1a, (b) GmCYP707A3b, (c) GmRD22, (d) GmRD20, (e) GmDREB1B, (f) GmERD1, (g) GmNFYA3, (h) FIB1a, (i) GmPIP1b, (j) GmGST, (k) GmBIP and (l) GmTp55. The values represented in the graphs were calculated from three independent experiments (n = 3). Significantly different values between the treatment and control are represented by different letters.

