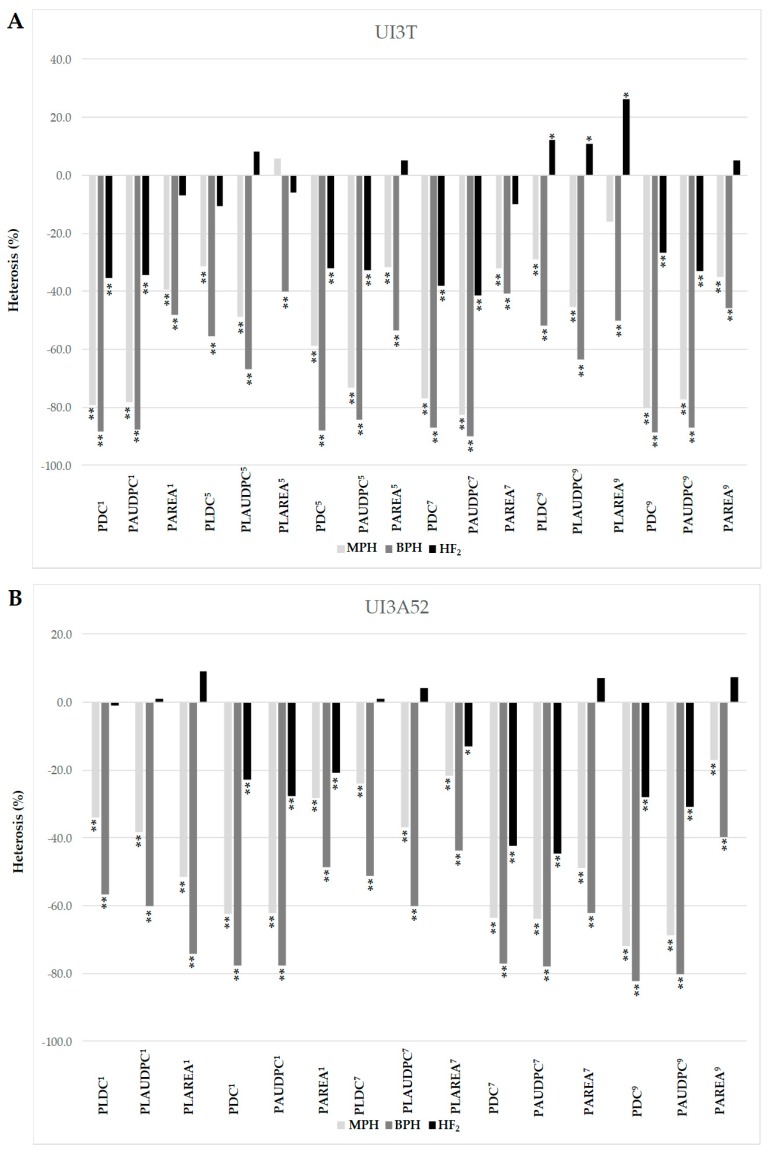
Figure 2.
Estimates of mid parent (MPH), better parent (BPH) and mid-F2 heterosis (HF2) (%) for primary leaf and pod resistance to halo blight races 1, 5, 7 and 9 for the UI3T (A) and UI3A52 (B) segregating generations. MPH = mid-parent heterosis (MPH (%) = (F1-MP/MP) × 100); BPH = better-parent heterosis (BPH (%) = (F1-BP/BP) × 100); HF2 = mid-F2 heterosis (HF2 = (2F2 − P1 − P2) × 100/(P1 + P2)). Heterosis significance was determined with the Wynne et al. [63] “t” test. Single and double asterisks indicate statistical significance levels at p ≤ 0.05 and p ≤ 0.01, respectively. PDC = pod disease score; PAUDPC = pod area under the disease progress curve; PAREA = size of the lesion on pods; PLDC = primary leaf disease score; PLAUDPC = primary leaf area under the disease progress curve; PLAREA = size of the lesion on primary leaves. Numerical superscripts refer to the race tested. The two primary (unifoliate) leaves of bean plants were inoculated with races 5 and 9 in UI3T and with races 1 and 7 in UI3A52 segregating generations.

