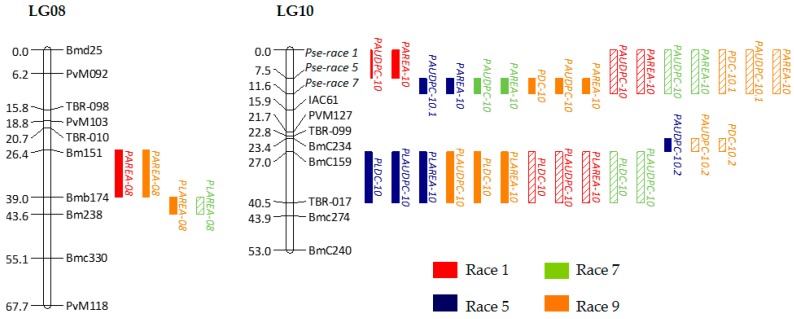
Figure 3.
The position of the identified QTLs on the LGs 08 and 10 in the common bean consensus map from F2 UI3T and UI3A52 populations. Distance in cM between markers is shown to the left of the LGs. Names of the markers are shown to the right. QTLs are presented as vertical bars to the right of the LGs. Colors identifying Psp races are shown. Single-locus effect QTLs detected in populations UI3T and UI3A52 are shown in solid color and diagonal strip bars, respectively.

